
Jump to:
3.1 Introduction 3.2 IPoA targets and Commonwealth LDCs’ global exports in comparative perspective 3.3 Export performance of Commonwealth LDCs by sector 3.4 Intra-Commonwealth trade in the IPoA period 3.5 Challenges faced by Commonwealth LDCs in expanding trade during the past decade 3.6 Conclusion
3.1 Introduction
The decade 2011-2020 proved challenging for LDC trade, including for the 14 Commonwealth LDCs. As the preceding chapter discussed, the inherent structural vulnerabilities in LDCs, together with pre-pandemic economic headwinds and COVID-related supply and demand disruptions at the end of the IPoA implementation period, exacerbated these trade challenges.
The IPoA sought to double the share of LDCs in global exports to 2 per cent by 2020. However, despite absolute growth in their exports during the implementation period, the export share of all 47 LDCs stagnated at around 1 per cent, even though the 14 Commonwealth LDCs performed marginally better. Their collective share in global exports increased slightly, and two LDCs – Rwanda and Tuvalu – almost doubled their shares. There was also a significant increase in the share of LDCs in intra-Commonwealth trade, which underpins their overall trade gains. Unfortunately, the COVID-19 pandemic has reversed most of this improvement.
This chapter evaluates the trade performance of Commonwealth LDCs between 2011 and 2020 vis-à-vis the IPoA targets, both for global and for intra-Commonwealth exports. It also examines some of the challenges these economies faced in meeting the trade targets. The analysis of the generally subdued trade performance of Commonwealth LDCs – and the LDC group more widely – during the IPoA offers insights that can help in preparing for better outcomes in the next decade.
3.2 IPoA targets and Commonwealth LDCs’ global exports in comparative perspective
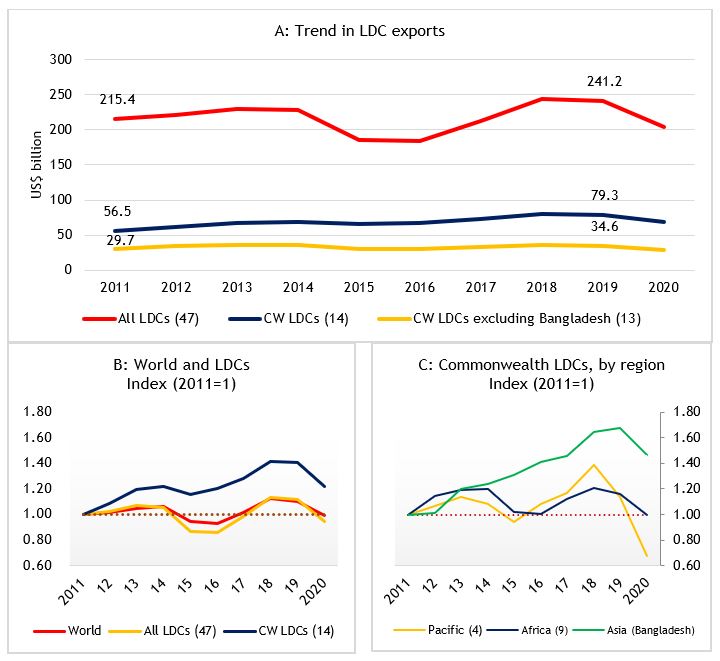
The combined value of all 47 LDCs’ global goods and services exports rose from US$215 billion in 2011 to just over $241 billion in 2019 (the highest level since 2000), representing an increase of around 12 per cent. Despite growing by $26 billion in absolute terms over this period, the share of LDC exports in world trade hovered around 1 per cent, both in 2011 and in 2019.
Commonwealth LDCs also expanded their global exports over this period. The combined value of their goods and services exports increased by 41 per cent, from US$57 billion to about $80 billion. More than half of this growth can be attributed to exports from Bangladesh. Bangladesh’s relative contribution to total exports by Commonwealth LDCs expanded by 9 percentage points – from 47 per cent in 2011 to 56 per cent in 2019. Exports from the Commonwealth’s African LDCs increased marginally from $29 billion to $34 billion, while those by Pacific members grew by a mere $120 million.
The trade gains during the pre-pandemic IPoA years vary enormously across LDC groups and geographical regions (panels B and C, Figure 18). Although the export share of all 47 LDCs stagnated at around 1 percent, the share for Commonwealth LDCs was 1.27 times greater in 2019 compared with the start of the IPoA in 2011. By the end of 2019, the trade share of Bangladesh was 1.5 times higher, while for African and Pacific members it remained largely unchanged. The Pacific members’ exports increased marginally during 2017 and 2018 but this rise proved transitory: a steeper decline in their exports with the onset of the COVID-19 pandemic reversed these trade gains (see Chapter 5). Consequently, the Pacific LDCs’ exports in 2020 were 40 per cent below 2011 levels.
Figure 18: Trend in LDC exports of goods and services, 2011-2020
Export performance was highly uneven across Commonwealth LDCs. The export shares of 11 members increased between 2011 and 2019, while those of three – Lesotho, Malawi and Zambia – declined. Only two LDCs, Rwanda and Tuvalu, substantially increased their shares of global exports and came close to achieving the IPoA target. In Rwanda, this was driven by growth in merchandise exports, whereas in Tuvalu the services sector experienced the highest growth. In value terms, Bangladesh recorded the largest increase in global exports, rising from US$27 billion to $44 billion (an increase of 67 per cent).
The export shares of the four Commonwealth LDCs in the Pacific were 1.15 times higher by the end of the pre-pandemic IPoA years. Although exports from Tuvalu almost doubled in value between 2011 and 2019, in Solomon Islands and Vanuatu the increases were far more muted, rising by around 13 per cent. The value of exports by Kiribati expanded 1.5 times over from a very small base, increasing by just over $11 million (Table A2).
Figure 19: Changes in Commonwealth LDCs’ shares of global exports between 2011 and 2020, by country (Index 2011=1)
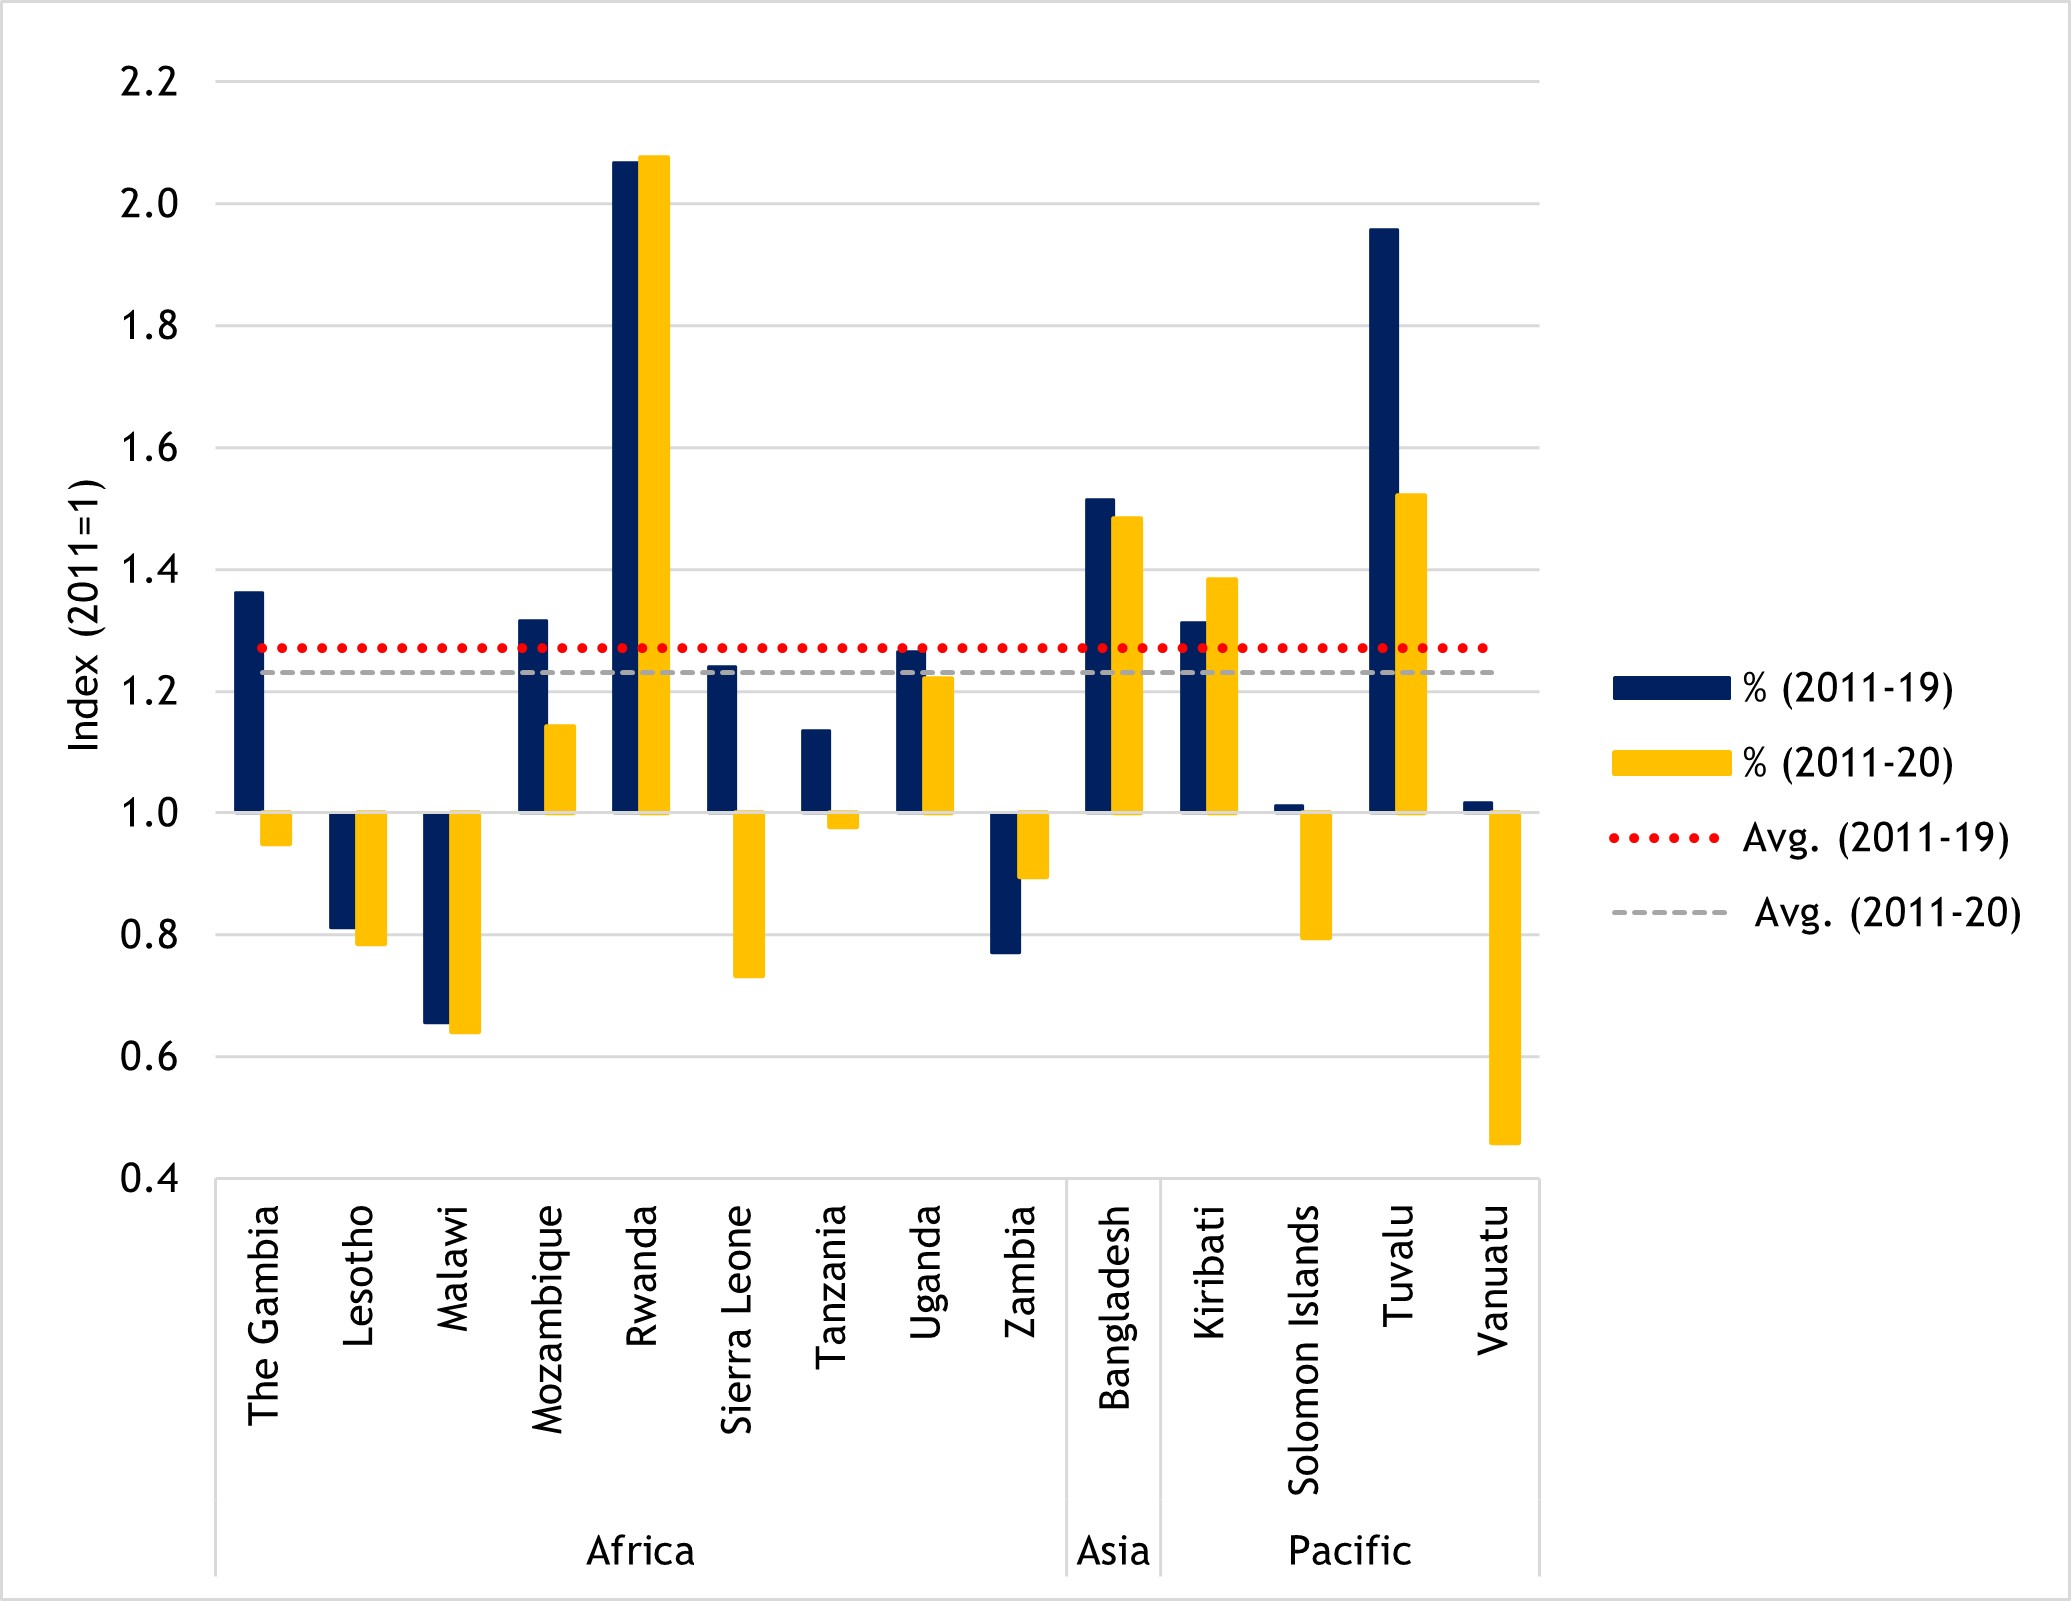
Source: Commonwealth Secretariat (calculated using UNCTADstat data)
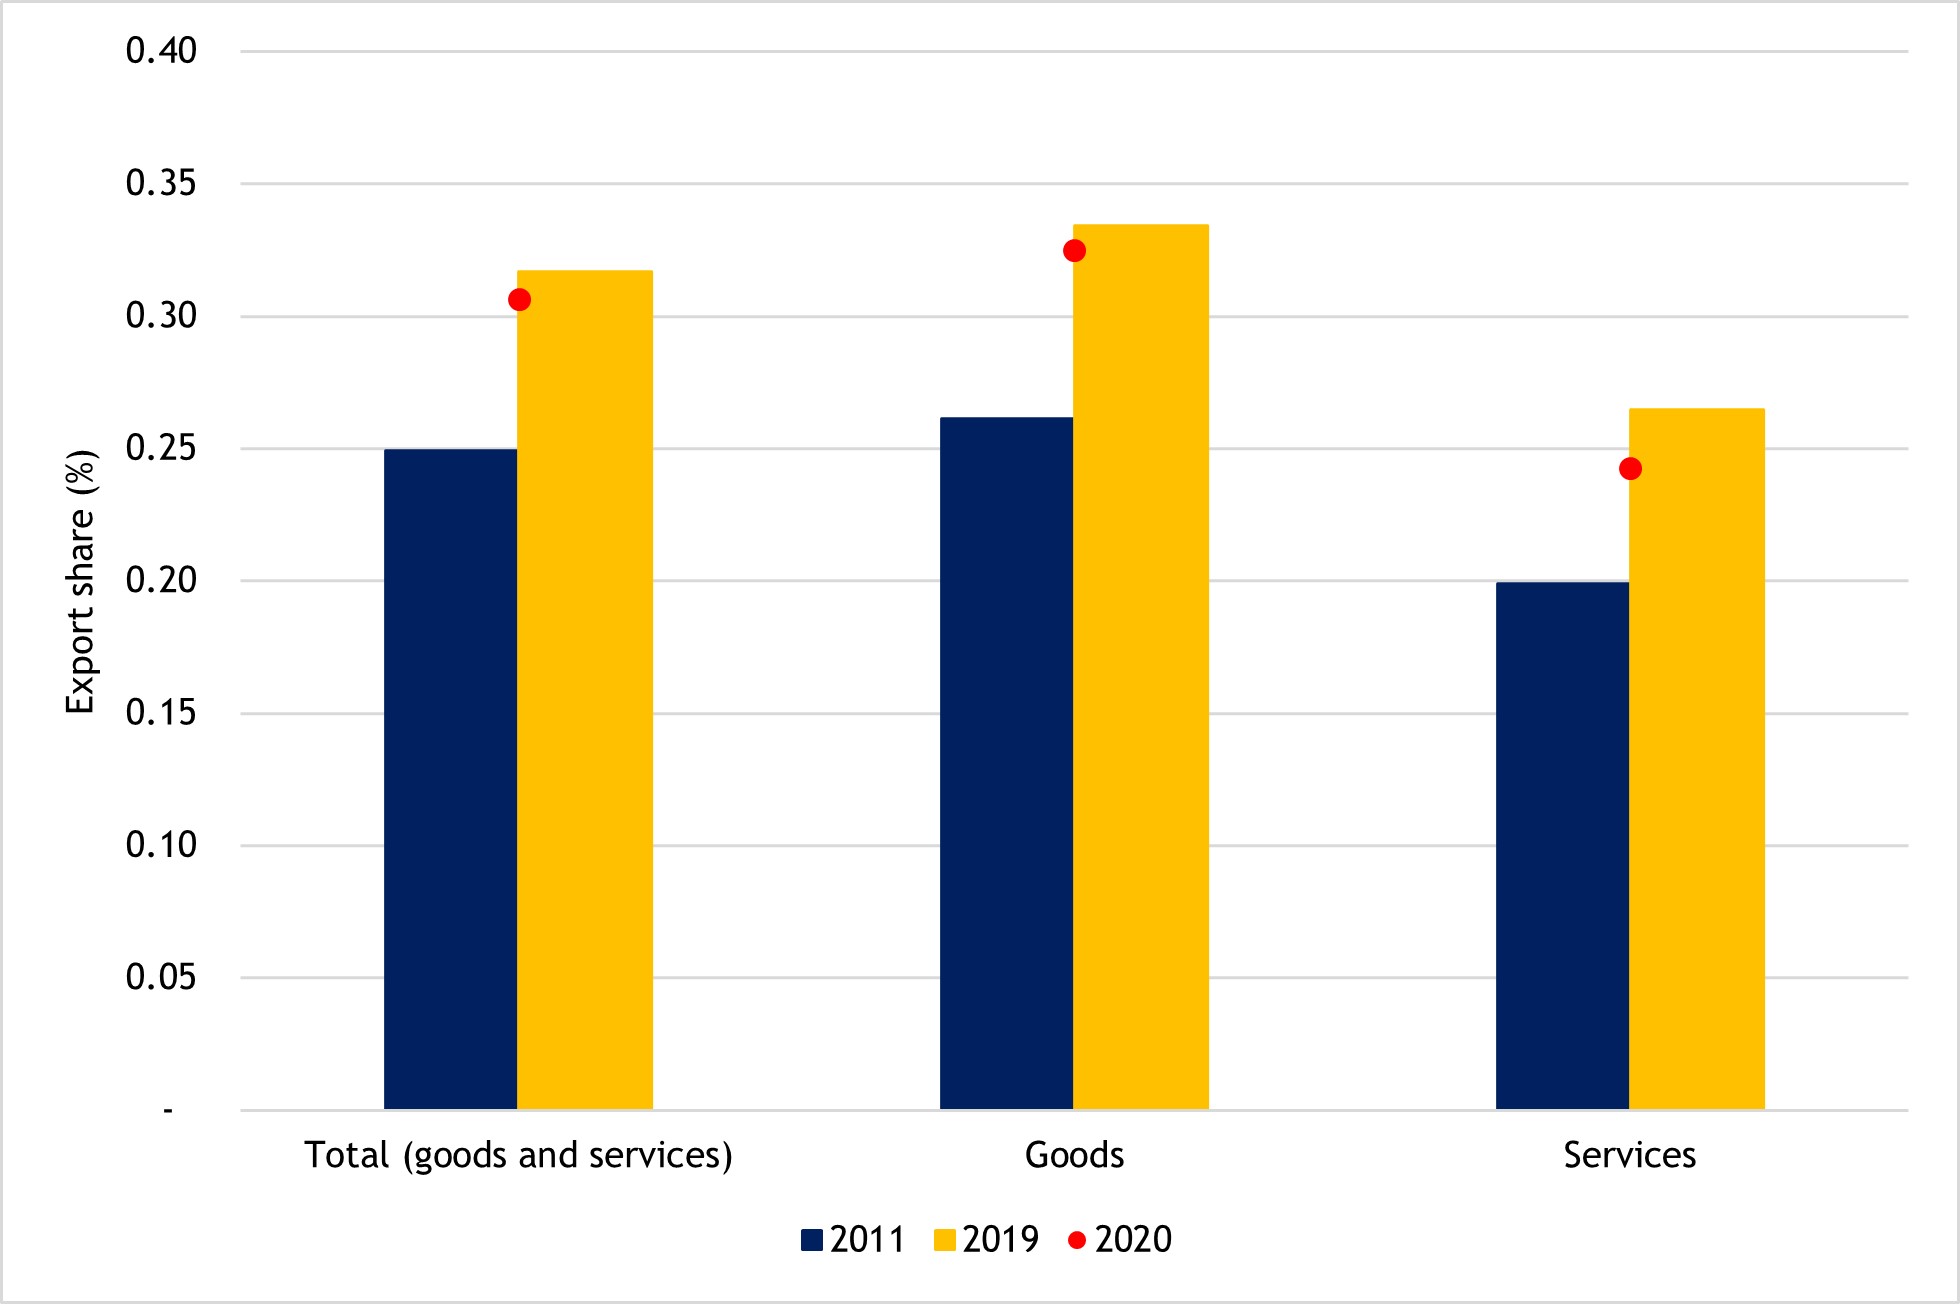
The generally modest export growth registered in most Commonwealth LDCs meant their collective share in world trade increased only slightly, from 0.25 per cent to 0.32 per cent (Figure 20). As mentioned above, this increase was driven primarily by a substantial rise in Bangladesh’s exports, whereas the growth in exports from African and Pacific Commonwealth LDCs was minimal.
Even so, Commonwealth LDCs generally performed better in growing trade compared with their non-Commonwealth counterparts. One reason for this is that Commonwealth LDCs achieved higher GDP growth in the pre-pandemic period of IPoA implementation, although there has been some decoupling of the link between GDP and trade growth (discussed further in Section 3.5). GDP grew at an average rate of 5.5 per cent across the 14 Commonwealth LDCs between 2011 and 2019, which is significantly higher than the corresponding figures for the world (2.2 per cent) as well as for all 47 LDCs (4.2 per cent). The higher GDP growth rates translated into larger volumes of trade flows. On average, exports from Commonwealth LDCs grew by 3.7 per cent per annum, compared with just 0.6 per cent for all 47 LDCs and 1.2 per cent across the world.
The second main reason for the relatively better export performance of Commonwealth LDCs stems from their large reliance on intra-Commonwealth trade (see Box 2). This is underpinned by a significant and growing “Commonwealth advantage” in trade, which has helped build, strengthen and sustain trading relationships between Commonwealth LDCs and other member countries. Historical ties, familiar legal and administrative systems, the widespread use of English and the presence of large and dynamic diasporas mean trade costs are around 21 per cent lower, on average, for Commonwealth country pairs compared with the cost of trading with non-Commonwealth countries (Commonwealth Secretariat, 2021).
Unfortunately, pandemic-related disruptions in 2020 reversed some of the growth in trade shares registered in several Commonwealth LDCs. While Bangladesh and Rwanda maintained their shares of global exports at 2019 levels, for five African members these declined: The Gambia, Lesotho, Malawi, Sierra Leone and Tanzania. Zambia was the only Commonwealth LDC whose share of global exports increased in 2020, mainly because of rising demand for copper in the transport (electric vehicles), renewable energy and manufacturing sectors. While Zambia’s services exports declined in 2020, the country’s merchandise exports expanded by US$1 billion (from $7 billion in 2019). Even so, Zambia’s share in global exports in 2020 was still below the 2011 level.
Figure 20: Commonwealth LDCs’ share in global exports, 2011, 2019 and 2020 (%)
3.3 Export performance of Commonwealth LDCs by sector
Growth in trade for Commonwealth LDCs varied by sector during the IPoA period. Before the onset of the pandemic, the services exports of Commonwealth LDCs grew faster than their merchandise exports. In value terms, their services exports increased by US$7.5 billion, from $9 billion in 2011 to around $17 billion in 2019. The cumulative growth in the value of their services exports in this period amounted to 85 per cent, almost three times greater than the growth in their merchandise exports (32 per cent). This led to a marginal increase in the share of Commonwealth LDCs in global services exports, from around 0.20 per cent in 2011 to about 0.26 per cent by 2019 (Figure 20). This rise occurred partly because of some success from 2011 in diversifying their previously narrow services export bases.
In contrast with the performance of their services sectors, Commonwealth LDCs registered slower growth in merchandise exports. The combined value of these exports expanded from US$48 billion to $57 billion, leading to an increase in the share of Commonwealth LDCs in global exports from 0.27 per cent to 0.33 per cent between 2011 and 2019. Much of the growth in merchandise exports stemmed from Bangladesh, where they expanded from $24 billion to $39 billion. In contrast, merchandise exports by the Commonwealth’s African LDCs flatlined in this period, stagnating at around $23 billion, while those in the Pacific region increased only marginally, by around $50 million (Table A2).
Despite the relatively better performance of services exports during the pre-pandemic period of IPoA implementation, Commonwealth LDCs still rely heavily on merchandise trade, which accounts for 80 per cent of their exports (Figure 21). Moreover, their merchandise exports have, in fact, shown greater resilience than their services exports in the wake of the COVID-19 pandemic: in 2020, services exports from Commonwealth LDCs contracted by 27 per cent while their merchandise exports shrank by 10 per cent (see Chapter 5 for a more detailed discussion). Owing to a huge decline in services exports in 2020, the share of merchandise in the total exports of all the regional groupings of Commonwealth LDCs has risen substantially. The Pacific LDCs, in particular, have seen a large increase in the relative share of merchandise exports.
Figure 21: Share of goods and services in LDCs total exports during 2011-2020, by region (%)
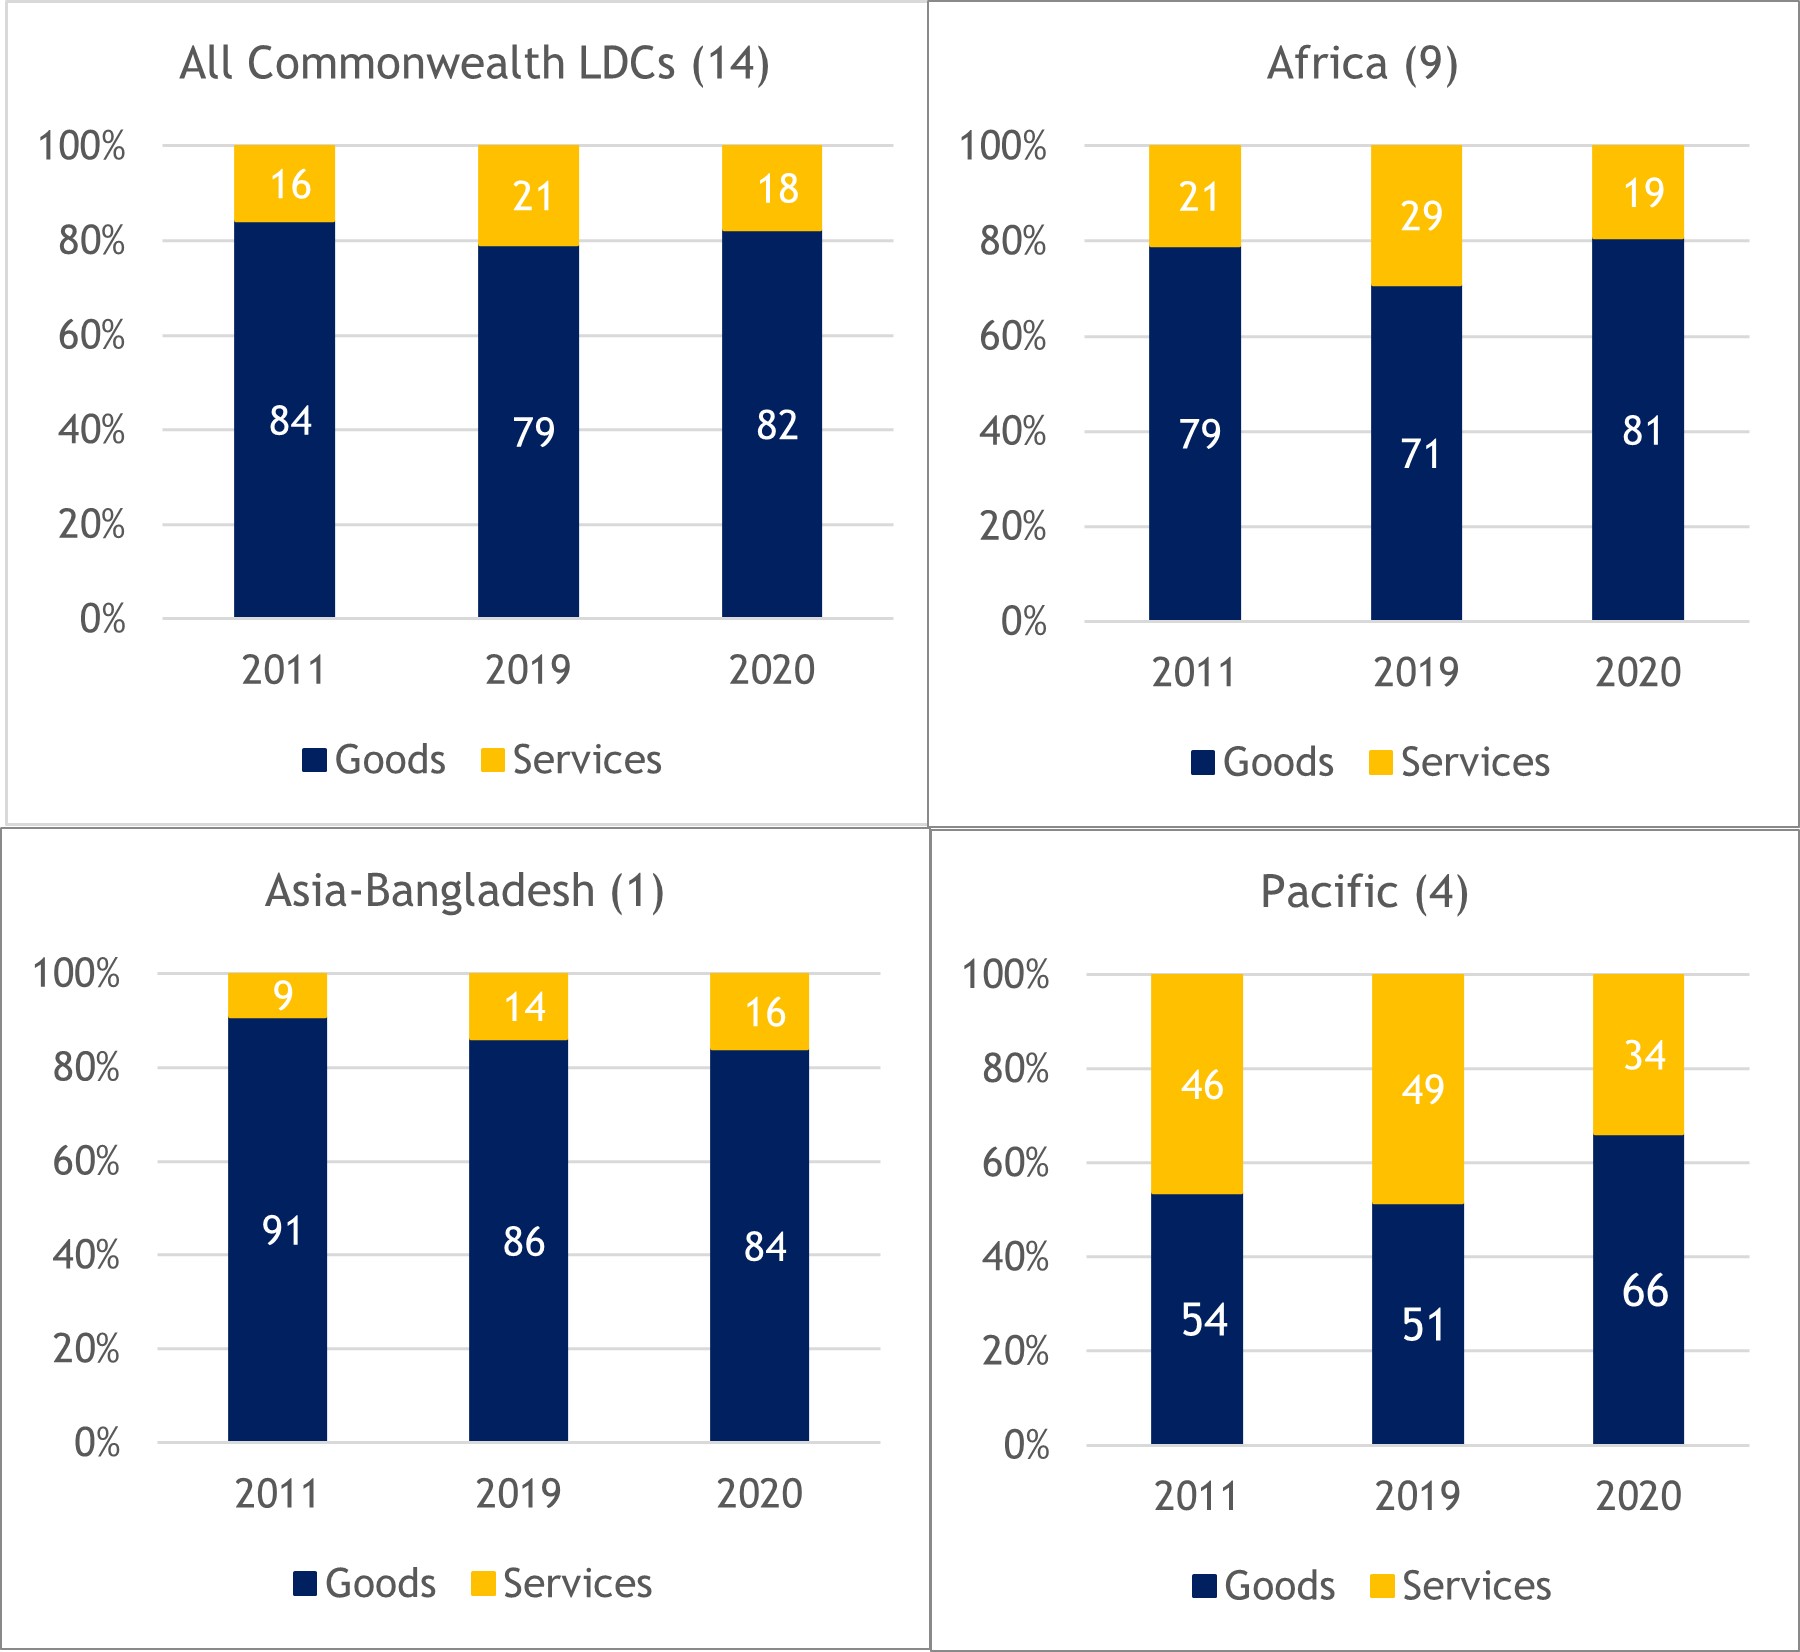
Source: Commonwealth Secretariat (calculated using UNCTADstat data)
3.4 Intra-Commonwealth trade in the IPoA period
As mentioned above, the trade performance of Commonwealth LDCs in the IPoA period was generally more robust compared with the overall LDC group. Among other factors, this reflects a significant contribution of intra-Commonwealth trade, especially for Asian and African members (Box 2). Commonwealth LDCs send around a quarter of their exports to other Commonwealth members. This large reliance on the markets of other Commonwealth countries warrants detailed analysis of their intra-Commonwealth trade performance in this period.
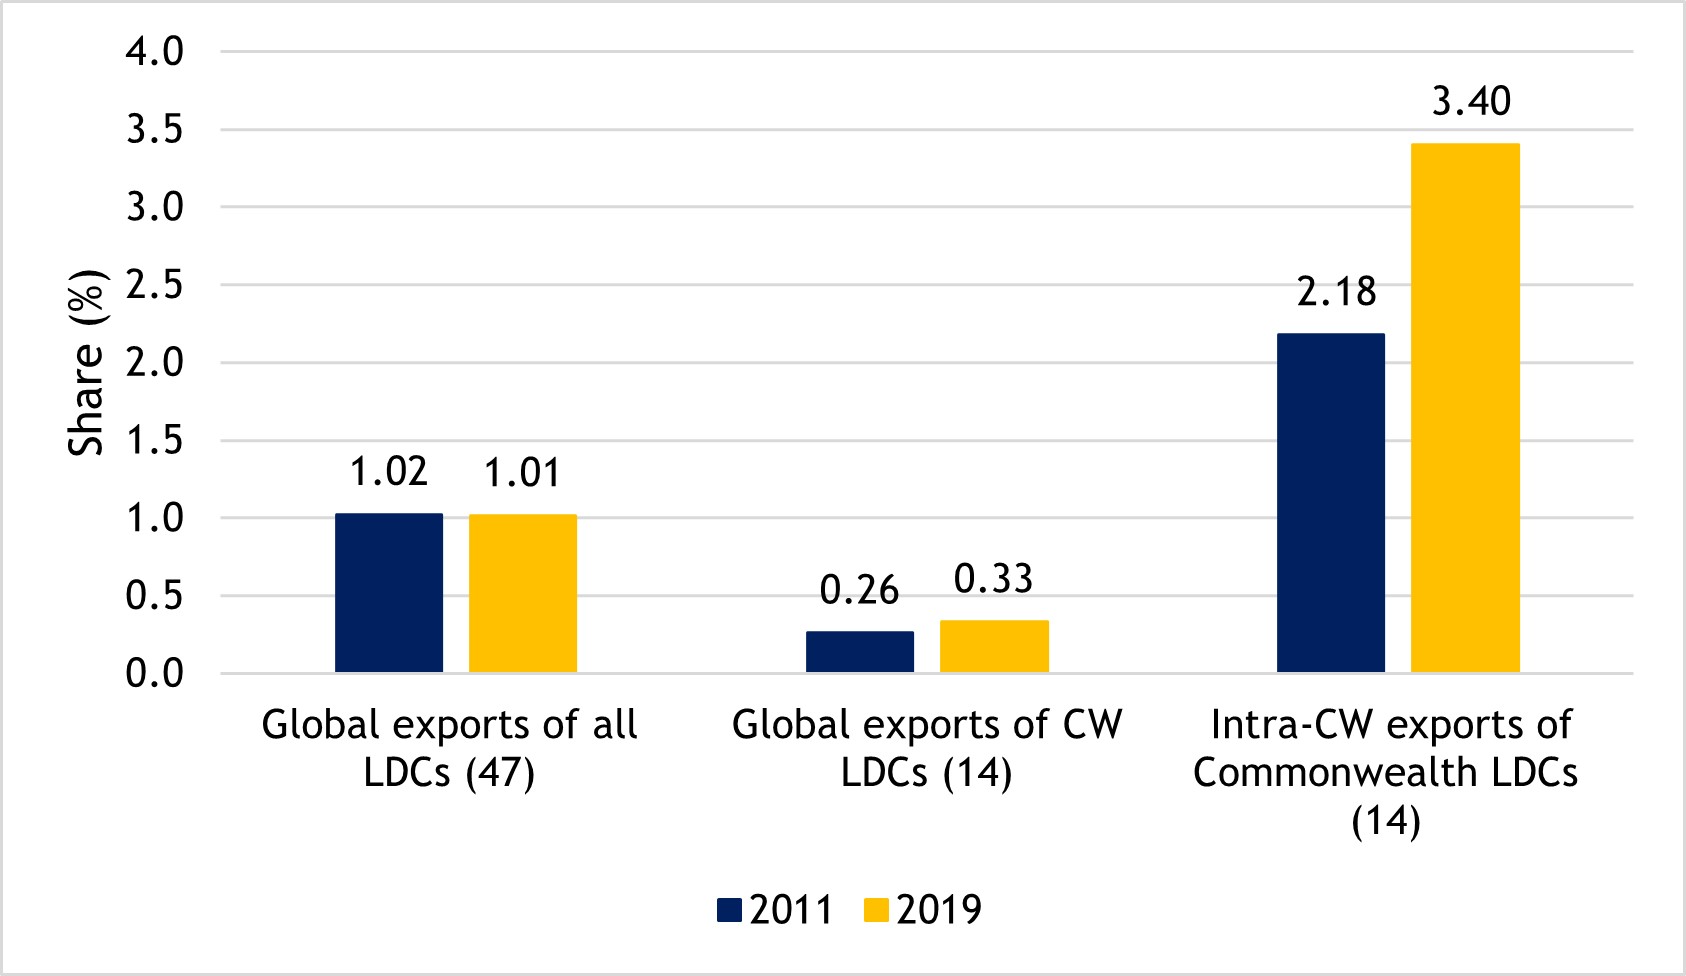
In 2011, the share of Commonwealth LDCs in intra-Commonwealth goods and services exports combined was 1.92 per cent – almost twice the corresponding share for all LDCs in world trade. During the pre-pandemic IPoA years (2011-2019), the export share for all 47 LDCs in world trade stagnated, whereas Commonwealth LDCs increased their share of intra-Commonwealth trade to 2.83 per cent (Commonwealth Secretariat, 2021). This increase owed mainly to a boost in merchandise trade, whose share almost doubled, from 2 per cent at the start of the IPoA to about 3.5 percent by 2019 (Figure 22).
While the combined share of all 47 LDCs in world merchandise exports declined, the share of Commonwealth LDCs in global merchandise trade increased from 0.26 per cent in 2011 to 0.33 per cent in 2019. A substantial portion of this increase is attributable to the export performance of Bangladesh, whose global exports increased by almost 65 per cent, from US$27 billion in 2011 to more than $45 billion in 2019. Despite this large increase, Bangladesh fell short of reaching the target set for all LDCs at the start of the IPoA to double their share in world exports. Nevertheless, it came closest to the target in the case of services exports, where the share was 1.83 times higher in 2019 compared with 2011; the equivalent share was 1.53 times higher in the case of merchandise exports (Table A2).
Figure 22: LDCs’ share in global and intra-Commonwealth merchandise exports, 2011 vs. 2019 (%)
Source: Commonwealth Secretariat (calculated using UNCTADstat and OECD–WTO BaTIS data)
|
Box 2: LDCs’ large reliance on intra-Commonwealth exports Intra-Commonwealth trade represents a substantial component of Commonwealth LDCs’ global exports. In 2019, a quarter (US$19 billion) of their global exports in goods and services combined ($79 billion) were sent to fellow Commonwealth countries. The relatively large reliance on the export markets of Commonwealth countries holds for both goods and services (Figure 23). Intra-Commonwealth trade is very much regional in nature. Most Commonwealth LDCs trade with major economies in their geographical regions. For instance, African LDCs have large trade engagements with South Africa, boosted essentially by their membership in the Southern African Development Community and the Southern African Customs Union in the case of Lesotho, while the Pacific LDCs rely mainly on the export markets of Australia and New Zealand. Intra-Commonwealth trade is more prevalent for African LDCs: in 2019, the nine LDCs in Sub-Saharan Africa contributed just over half (or US$9.6 billion) of the total intra-Commonwealth exports of the 14 Commonwealth LDCs ($19 billion). A large proportion of this intra-Commonwealth trade involving LDCs occurs among Sub-Saharan African members. Between 15 and 30 per cent of the exports of four LDCs – Mozambique, Tanzania, Uganda and Zambia – are destined for other African Commonwealth countries. Of the nine African LDCs, Mozambique, Tanzania and Zambia are both significant intra-Commonwealth traders as well as major intra-African traders. However, Bangladesh is the largest intra-Commonwealth LDC exporter in value terms, sending almost three times more goods and services combined to other Commonwealth markets compared with Mozambique, Tanzania and Zambia, which are next in line (Table A3). Figure 23: LDCs’ dependence on intra-Commonwealth’s exports, 2019 (%) Image
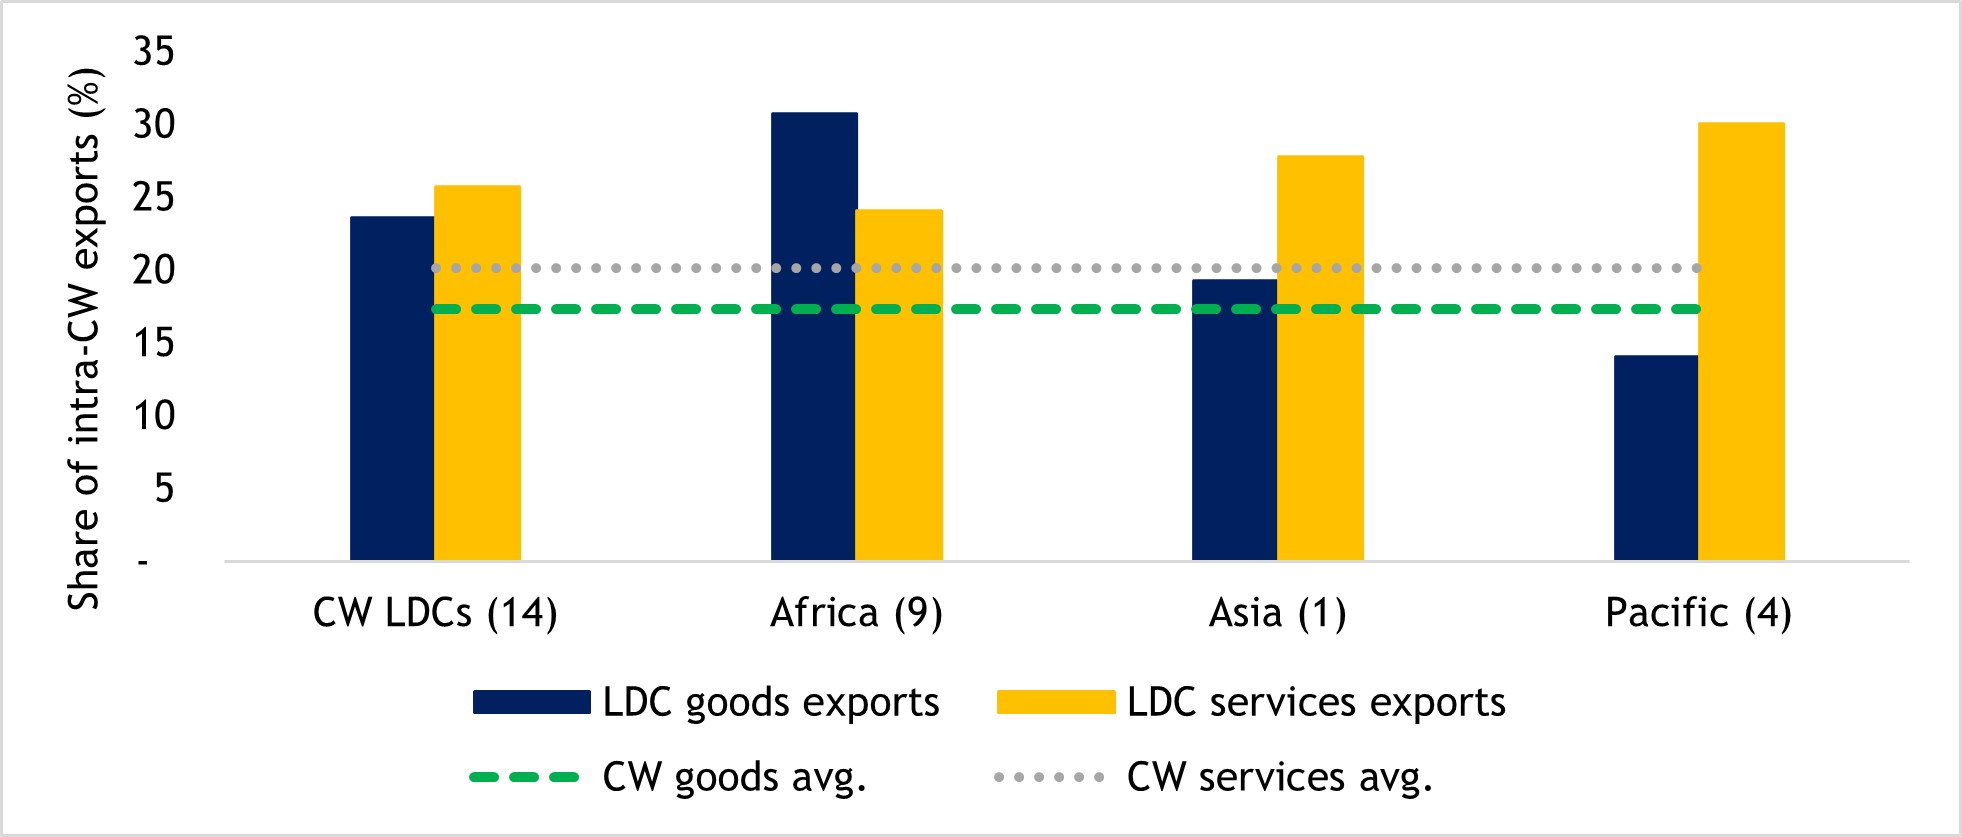
Source: Commonwealth Secretariat (calculated using UNCTADstat and OECD-WTO BaTIS data) The structure of intra-Commonwealth trade involving LDCs closely mirrors that of their global exports. African LDCs mainly export merchandise whereas the Pacific LDCs export services to other Commonwealth members. Source: Commonwealth Secretariat |
3.5 Challenges faced by Commonwealth LDCs in expanding trade during the past decade
The lingering effects of the global financial crisis (2007-2008) and the trade slowdown in 2015 and 2016 affected the export performance of Commonwealth LDCs. As a result of these multiple shocks, Commonwealth LDCs were already set to miss the IPoA trade targets when the COVID-19 pandemic struck in early 2020. The pandemic exacerbated their pre-existing structural challenges and created new difficulties, in the process offsetting some of the progress made during the IPoA period. In 2020, exports by Commonwealth LDCs contracted to a greater extent than those for the rest of the world: the value of global merchandise exports declined by 12 per cent, whereas it shrank by 16 per cent across the 14 Commonwealth LDCs (see Chapter 5). As a result of this massive decline, their global and intra-Commonwealth exports reverted to 2016 levels, further attenuating the modest export increase observed over the full course of the IPoA implementation period. The services-dependent economies of the Pacific LDCs were hit very hard. Chapter 5 discusses these and other impacts of the pandemic on the economies of Commonwealth LDCs in detail.
Figure 24: The trade and growth nexus in LDCs, 2011-2019 (growth rate %)
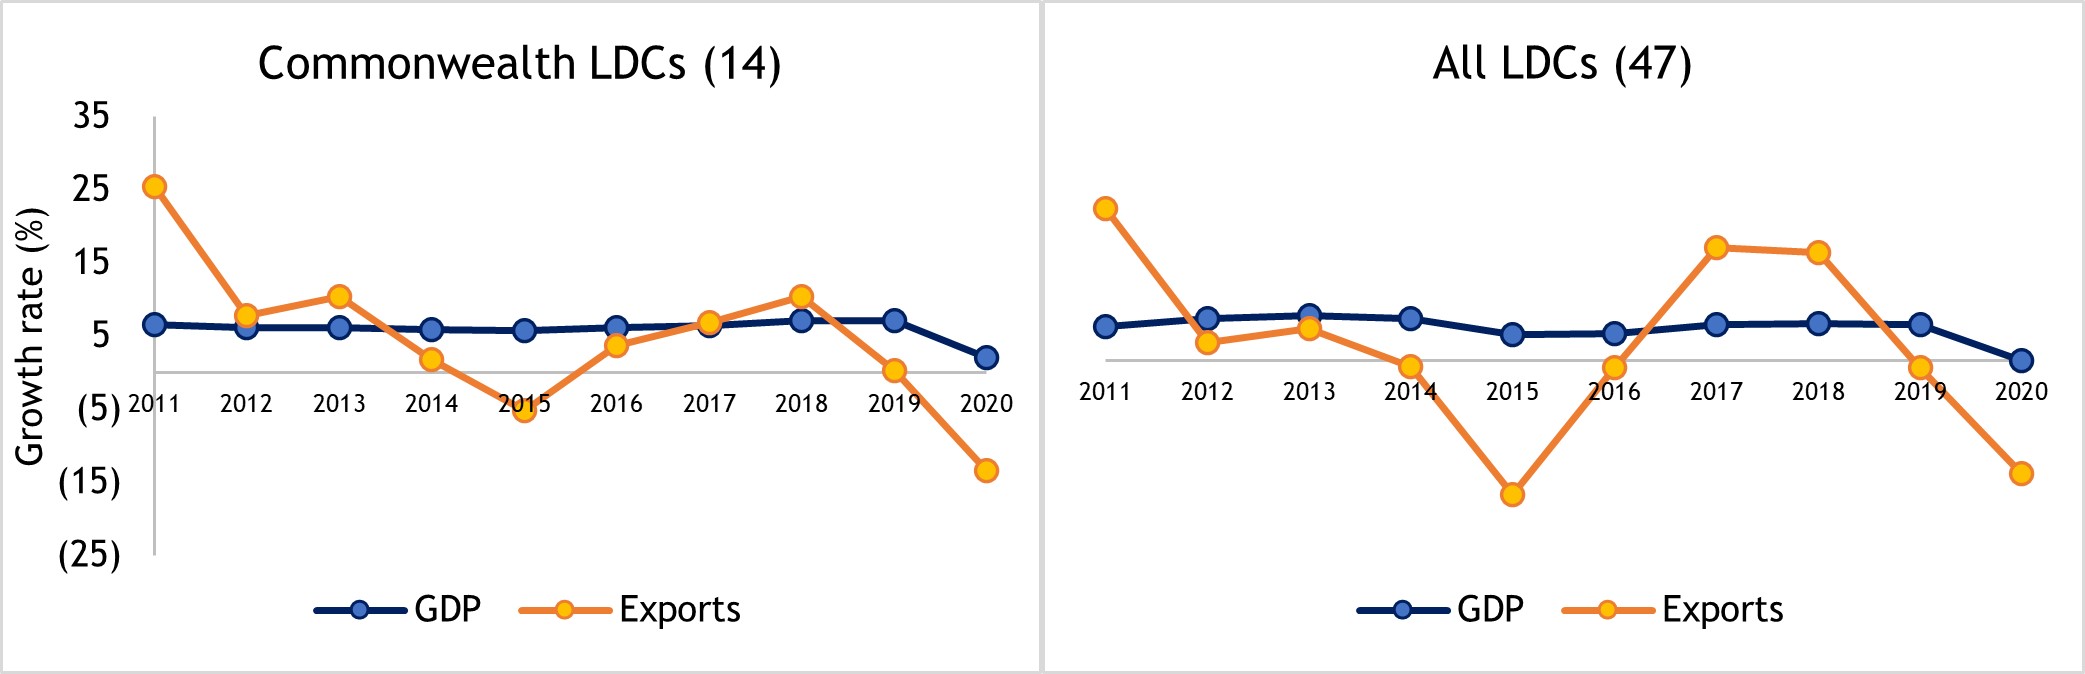
In addition to COVID-19, several pre-pandemic factors contributed to missed IPoA targets. For instance, structural and cyclical factors continued to hinder the economic growth of African LDCs, while natural disasters constrained economic activities in the Pacific members. With limited productive capabilities and inherent structural vulnerabilities, LDCs lack the resilience to withstand these numerous economic shocks (see Chapter 2). Overall, their economies are insufficiently diversified, and they rely heavily on exports of a narrow range of primary commodities.[1] This product concentration has made their export growth highly volatile. Another salient feature of the past decade is the weakening link between trade and growth in LDCs: relatively stable GDP growth has not translated into substantial export growth (Figure 24).
A key source of LDC vulnerability is their narrow production and export base. Merchandise exports constitute around 80 per cent of their global exports, on average. In some Commonwealth LDCs this share is even higher: for instance, the share of merchandise in Bangladesh’s global exports is above 86 per cent. More than 71 per cent of the exports of African LDCs comprise merchandise. Within Africa, The Gambia is an outlier, with around 63 per cent of services in its global exports (largely travel, transport and telecommunication). This is more in line with the Pacific LDCs, where services constitute about 50 per cent of exports, on average, and more than 90 per cent in Tuvalu and Vanuatu (Table A3). This excessive reliance on services – many of which are delivered through in-person interactions – has amplified the impact of the COVID-19 shock.
Many LDCs face high and unstainable debt levels, and several are classified as under high risk of debt distress (see Chapter 4). The resulting lack of fiscal space constrains the ability of their governments to invest in the necessary infrastructure to support trade and to expand trade finance.
3.6 Conclusion
The period 2011–2020 can be regarded as a “lost decade” in terms of the gains from trade for most Commonwealth LDCs. These economies faced inherent structural challenges and a less than conducive global trading environment, which significantly affected efforts to expand their trade flows. Commonwealth LDCs have clearly missed the target of doubling their share of global exports in the IPoA period. As a group, the combined exports of Commonwealth LDCs increased by 27 per cent during 2011-2019. Although this increase is very small, it compares favourably with the equivalent growth in exports achieved across all 47 LDCs, whose overall share of global trade plateaued at around 1 per cent throughout the IPoA period.[2] The relatively better trade performance of the Commonwealth LDC group is partly linked to the impressive growth of their intra-Commonwealth merchandise exports,[3] and partly to the large export growth recorded by Bangladesh.
LDCs should continue to build their trade capacity, including export supply response and trade-related institutional development, by making use of Aid for Trade initiatives like the Enhanced Integrated Framework (EIF) and other providers. They can also draw on support from the United Nations Technology Bank for LDCs and the Global Environment Facility Least Developed Countries Fund to support adaptation and a green recovery from the pandemic.
LDCs should aim to further expand their trade with the Global South – not least by utilising the tariff preferences China and India offer – while exploiting any market access advantage in their traditional export destinations in developed countries, such as the EU Everything But Arms scheme. There is scope to extend these preferences to include services under an agreed waiver at the World Trade Organization (WTO). However, it is necessary to build institutional mechanisms and key stakeholder partnerships as well as supply-side capacity in LDCs to utilise these preferences.
Expanding trade through regional engagements could be another strategy for LDCs, including mega regional trading blocs like the African Continental Free Trade Area, the Regional Comprehensive Economic Partnership and the Comprehensive and Progressive Agreement for Trans-Pacific Partnership. Numerous analyses have shown that the trade potential of regional trading arrangements involving developing countries has remained largely unutilised. Furthermore, effective implementation of many of these agreements has been either very slow or non-existent.
Finally, LDCs should co-ordinate among themselves and work with other regional and international stakeholders to engage with development partners at the United Nations' LDC5 and beyond so that trade and development-related international commitments are enhanced in the next programme of action (Razzaque et al., 2019).
[1] Except for Bangladesh, all Commonwealth LDCs are commodity dependent, with the share of commodities constituting more than 60 per cent of their merchandise exports (Ali et al., 2020).
[2] Between 2011 and 2019, global exports and exports from LDCs grew at a similar rate (around 4 per cent), on average, leading to stagnation in LDCs’ share in world trade.
[3] Commonwealth LDCs’ share in intra-Commonwealth merchandise exports almost doubled in this period.