Table A1: Selected indicators of progress in other IPoA priority areas, 2011-2020
|
Country |
2011 |
2012 |
2013 |
2014 |
2015 |
2016 |
2017 |
2018 |
2019 |
2020 |
Agriculture, food security and rural development |
||||||||||
|
Prevalence of moderate or severe food insecurity (% of total population) |
||||||||||
|
Bangladesh |
|
|
|
|
32.2 |
31.9 |
31.5 |
31.5 |
31.9 |
|
|
The Gambia |
|
|
|
|
52.7 |
52.7 |
52.7 |
54.3 |
56.0 |
|
|
Kiribati |
|
|
|
|
|
|
|
40.9 |
40.9 |
|
|
Lesotho |
|
|
|
|
|
|
|
|
49.7 |
|
|
Malawi |
|
|
|
|
81.9 |
81.9 |
81.8 |
81.8 |
81.8 |
|
|
Mozambique |
|
|
|
|
|
|
|
|
71.1 |
|
|
Sierra Leone |
|
|
|
|
78.4 |
79.2 |
79.9 |
80.6 |
83.9 |
|
|
Tanzania |
|
|
|
|
|
55.0 |
55.0 |
55.0 |
56.4 |
|
|
Uganda |
|
|
|
|
58.0 |
60.7 |
63.4 |
66.3 |
69.2 |
|
|
Vanuatu |
|
|
|
|
|
|
|
23.3 |
23.3 |
|
|
Zambia |
|
|
|
|
48.8 |
49.4 |
50.1 |
50.8 |
51.4 |
|
|
Non-CW LDC avg. |
|
|
|
|
58.7 |
58.7 |
59.2 |
55.3 |
57.2 |
|
|
Developing country avg. (excl. LDCs) |
|
|
|
|
50.2 |
46.1 |
50.9 |
53.6 |
31.8 |
|
Human and social development |
||||||||||
|
Bangladesh |
|
|
|
|
|
|
0.48 |
0.46 |
|
0.46 |
|
The Gambia |
|
|
|
|
|
|
0.40 |
0.40 |
|
0.42 |
|
Kiribati |
|
|
|
|
|
|
0.48 |
0.47 |
|
0.49 |
|
Lesotho |
|
|
|
|
|
|
0.37 |
0.40 |
|
0.40 |
|
Malawi |
|
|
|
|
|
|
0.41 |
0.41 |
|
0.41 |
|
Mozambique |
|
|
|
|
|
|
0.36 |
0.36 |
|
0.36 |
|
Rwanda |
|
|
|
|
|
|
0.37 |
0.38 |
|
0.38 |
|
Sierra Leone |
|
|
|
|
|
|
0.35 |
0.35 |
|
0.36 |
|
Solomon Islands |
|
|
|
|
|
|
0.44 |
0.43 |
|
0.42 |
|
Tanzania |
|
|
|
|
|
|
0.40 |
0.39 |
|
0.39 |
|
Tuvalu |
|
|
|
|
|
|
0.55 |
0.44 |
|
0.45 |
|
Uganda |
|
|
|
|
|
|
0.38 |
0.38 |
|
0.38 |
|
Vanuatu |
|
|
|
|
|
|
0.47 |
0.44 |
|
0.45 |
|
Zambia |
|
|
|
|
|
|
0.40 |
0.39 |
|
0.40 |
|
CW LDC avg. |
|
|
|
|
|
|
0.42 |
0.41 |
|
0.41 |
|
Non-CW LDC avg. |
|
|
|
|
|
|
0.39 |
0.39 |
|
0.39 |
|
Developing country avg. (non-LDCs) |
|
|
|
|
|
|
0.55 |
0.55 |
|
0.55 |
|
Bangladesh |
0.535 |
0.549 |
0.559 |
0.567 |
0.572 |
0.572 |
0.588 |
0.599 |
0.609 |
0.614 |
|
The Gambia |
0.434 |
0.437 |
0.435 |
0.441 |
0.448 |
0.449 |
0.454 |
0.456 |
0.459 |
0.466 |
|
Kiribati |
0.585 |
0.589 |
0.587 |
0.596 |
0.605 |
0.613 |
0.619 |
0.622 |
0.623 |
0.623 |
|
Lesotho |
0.455 |
0.461 |
0.47 |
0.48 |
0.486 |
0.493 |
0.499 |
0.507 |
0.514 |
0.518 |
|
Malawi |
0.426 |
0.437 |
0.447 |
0.452 |
0.463 |
0.472 |
0.475 |
0.478 |
0.482 |
0.485 |
|
Mozambique |
0.389 |
0.396 |
0.391 |
0.398 |
0.412 |
0.42 |
0.428 |
0.435 |
0.442 |
0.446 |
|
Rwanda |
0.472 |
0.488 |
0.496 |
0.504 |
0.506 |
0.513 |
0.515 |
0.525 |
0.529 |
0.536 |
|
Sierra Leone |
0.386 |
0.391 |
0.398 |
0.413 |
0.426 |
0.43 |
0.422 |
0.423 |
0.435 |
0.438 |
|
Solomon Islands |
0.506 |
0.524 |
0.532 |
0.546 |
0.55 |
0.551 |
0.555 |
0.553 |
0.555 |
0.557 |
|
Tanzania |
0.584 |
0.585 |
0.585 |
0.584 |
0.588 |
0.589 |
0.592 |
0.592 |
0.595 |
0.597 |
|
Tuvalu |
0.478 |
0.489 |
0.494 |
0.497 |
0.503 |
0.509 |
0.515 |
0.52 |
0.522 |
0.528 |
|
Uganda |
0.479 |
0.487 |
0.492 |
0.501 |
0.503 |
0.509 |
0.519 |
0.518 |
0.522 |
0.528 |
|
Vanuatu |
0.521 |
0.531 |
0.541 |
0.552 |
0.559 |
0.565 |
0.57 |
0.58 |
0.589 |
0.591 |
|
Zambia |
0.481 |
0.490 |
0.494 |
0.502 |
0.509 |
0.514 |
0.519 |
0.524 |
0.529 |
0.533 |
|
CW LDC avg. |
0.457 |
0.463 |
0.472 |
0.477 |
0.482 |
0.488 |
0.491 |
0.494 |
0.497 |
0.499 |
|
Non-CW LDC avg. |
0.691 |
0.695 |
0.701 |
0.706 |
0.711 |
0.715 |
0.719 |
0.722 |
0.724 |
0.726 |
|
Developing country avg. (non-LDCs) |
0.535 |
0.549 |
0.559 |
0.567 |
0.572 |
0.572 |
0.588 |
0.599 |
0.609 |
0.614 |
|
Bangladesh |
2.1 |
2.2 |
2.0 |
|
|
1.5 |
|
|
1.3 |
|
|
The Gambia |
2.5 |
2.6 |
1.8 |
2.2 |
2.2 |
2.0 |
|
2.4 |
|
|
|
Kiribati |
|
|
|
|
|
|
|
|
|
|
|
Lesotho |
|
|
|
|
|
|
8.0 |
7.0 |
|
|
|
Malawi |
4.2 |
|
5.4 |
4.8 |
5.6 |
4.7 |
4.0 |
4.7 |
|
|
|
Mozambique |
|
5.7 |
6.1 |
|
|
5.9 |
5.5 |
5.5 |
|
|
|
Rwanda |
4.4 |
4.4 |
4.7 |
4.2 |
3.6 |
3.4 |
3.1 |
3.1 |
|
|
|
Sierra Leone |
2.7 |
2.9 |
2.4 |
2.7 |
|
3.1 |
4.6 |
7.0 |
7.7 |
|
|
Solomon Islands |
|
|
|
|
|
|
|
|
|
|
|
Tanzania |
|
|
|
3.4 |
|
|
4.4 |
3.7 |
|
|
|
Tuvalu |
|
|
|
|
|
|
|
|
|
|
|
Uganda |
2.3 |
1.8 |
1.9 |
1.9 |
2.3 |
2.2 |
2.3 |
2.1 |
|
|
|
Vanuatu |
|
|
|
4.9 |
5.4 |
|
4.5 |
|
|
|
|
Zambia |
|
|
|
|
4.6 |
3.7 |
3.7 |
4.6 |
|
|
|
CW LDC avg. |
3.0 |
3.3 |
3.5 |
3.4 |
4.0 |
3.3 |
4.5 |
4.5 |
4.5 |
|
|
Non-CW LDC avg. |
3.4 |
3.5 |
3.5 |
3.8 |
4.1 |
3.9 |
4.0 |
4.1 |
1.9 |
|
|
Developing country avg. (non-LDCs) |
4.1 |
4.1 |
4.3 |
4.5 |
4.7 |
4.6 |
4.4 |
4.3 |
4.5 |
|
|
Bangladesh |
4.8 |
5.3 |
5.7 |
5.8 |
5.5 |
5.2 |
5.8 |
5.9 |
6.1 |
6.1 |
|
The Gambia |
2.7 |
2.8 |
3.1 |
3.2 |
3.4 |
3.5 |
3.5 |
3.5 |
3.5 |
3.7 |
|
Kiribati |
7.8 |
7.9 |
7.9 |
7.9 |
7.9 |
7.9 |
7.9 |
7.9 |
7.9 |
7.9 |
|
Lesotho |
5.9 |
5.6 |
5.8 |
5.9 |
6 |
6.1 |
6.1 |
6.3 |
6.3 |
6.3 |
|
Malawi |
4.1 |
4.3 |
4.3 |
4.3 |
4.4 |
4.4 |
4.4 |
4.5 |
4.5 |
4.6 |
|
Mozambique |
3.1 |
3.2 |
2.5 |
2.7 |
2.8 |
3 |
3.1 |
3.3 |
3.5 |
3.5 |
|
Rwanda |
3.3 |
3.8 |
3.8 |
3.7 |
3.8 |
4 |
4 |
4.1 |
4.3 |
4.4 |
|
Sierra Leone |
3 |
3.1 |
3.1 |
3.2 |
3.3 |
3.3 |
3.4 |
3.4 |
3.5 |
3.6 |
|
Solomon Islands |
5 |
5.1 |
5.2 |
5.2 |
5.3 |
5.3 |
5.4 |
5.4 |
5.5 |
5.5 |
|
Tanzania |
5 |
5.1 |
5.1 |
5.5 |
5.6 |
5.7 |
5.9 |
6 |
6 |
6 |
|
Uganda |
5.2 |
5.7 |
5.4 |
5.3 |
5.4 |
5.5 |
5.7 |
5.7 |
5.8 |
6.1 |
|
Vanuatu |
6.6 |
6.7 |
6.7 |
6.8 |
6.8 |
6.8 |
6.8 |
6.7 |
6.8 |
6.8 |
|
Zambia |
6.5 |
6.6 |
6.7 |
6.7 |
6.8 |
6.8 |
6.8 |
7 |
7.1 |
7.1 |
|
CW LDC avg. |
4.8 |
5.0 |
5.0 |
5.1 |
5.2 |
5.2 |
5.3 |
5.4 |
5.4 |
5.5 |
|
Non-CW LDC avg. |
3.4 |
3.5 |
3.6 |
3.7 |
3.8 |
3.9 |
3.9 |
4.0 |
4.1 |
4.1 |
|
Developing country avg. (non-LDCs) |
8.0 |
8.1 |
8.3 |
8.4 |
8.5 |
8.6 |
8.7 |
8.8 |
8.8 |
8.8 |
|
Bangladesh |
|
|
|
|
|
|
|
|
|
|
|
The Gambia |
65.4 |
67.6 |
65.8 |
68.7 |
71.9 |
73.6 |
76.1 |
76.8 |
|
|
|
Kiribati |
|
|
|
97.4 |
95.8 |
97.5 |
94.7 |
|
|
|
|
Lesotho |
88.9 |
89.2 |
86.4 |
87.4 |
88.6 |
90.6 |
93.3 |
|
|
|
|
Malawi |
|
|
|
|
|
|
|
|
|
|
|
Mozambique |
87.5 |
87.7 |
88.9 |
89.9 |
91.5 |
90.8 |
89.9 |
93.9 |
|
|
|
Rwanda |
|
|
|
|
|
98.8 |
96.9 |
94.8 |
|
|
|
Sierra Leone |
|
94.6 |
96.4 |
|
95.1 |
98.1 |
|
|
|
|
|
Solomon Islands |
|
|
70.6 |
70.2 |
70.6 |
72.4 |
69.5 |
67.5 |
|
|
|
Tanzania |
|
87.5 |
84.0 |
83.3 |
|
83.5 |
83.6 |
81.3 |
|
|
|
Tuvalu |
|
|
|
80.2 |
81.3 |
76.2 |
|
|
|
|
|
Uganda |
94.7 |
|
95.5 |
|
|
|
|
|
|
|
|
Vanuatu |
|
|
|
|
79.8 |
|
|
|
|
|
|
Zambia |
87.9 |
89.2 |
86.6 |
|
|
|
83.2 |
|
|
|
|
CW LDC avg. |
84.9 |
86.0 |
84.3 |
82.5 |
84.3 |
86.8 |
85.9 |
82.9 |
|
|
|
Non-CW LDC avg. |
72.3 |
78.1 |
75.0 |
77.6 |
75.6 |
77.9 |
79.3 |
83.2 |
81.4 |
|
|
Developing country avg. (non-LDCs) |
92.1 |
91.5 |
91.4 |
91.6 |
90.9 |
92.0 |
92.3 |
91.5 |
86.5 |
|
|
Bangladesh |
47.3 |
49.7 |
54.3 |
|
59.1 |
65.2 |
63.7 |
66.5 |
|
|
|
The Gambia |
|
|
|
|
|
|
|
|
|
|
|
Kiribati |
|
|
|
|
|
|
|
|
|
|
|
Lesotho |
39.0 |
40.2 |
40.6 |
40.6 |
41.9 |
41.4 |
|
|
|
|
|
Malawi |
30.1 |
30.5 |
32.7 |
33.5 |
34.2 |
33.0 |
|
34.2 |
|
|
|
Mozambique |
17.1 |
17.5 |
19.9 |
20.2 |
19.3 |
|
|
|
|
|
|
Rwanda |
|
|
|
|
28.1 |
28.1 |
|
35.9 |
|
|
|
Sierra Leone |
|
|
33.4 |
|
32.5 |
|
38.3 |
41.8 |
|
|
|
Solomon Islands |
|
|
|
|
|
|
|
|
|
|
|
Tanzania |
|
|
|
|
|
23.9 |
24.6 |
26.5 |
|
|
|
Tuvalu |
|
|
|
68.0 |
69.7 |
58.5 |
|
66.7 |
|
|
|
Uganda |
|
|
|
|
|
|
|
|
|
|
|
Vanuatu |
|
|
|
|
48.9 |
|
|
|
|
|
|
Zambia |
|
|
|
|
|
|
|
|
|
|
|
CW LDC avg. |
33.3 |
34.4 |
36.2 |
40.6 |
41.7 |
41.7 |
42.2 |
45.3 |
|
|
|
Non-CW LDC avg. |
30.0 |
34.3 |
40.7 |
39.0 |
35.5 |
42.7 |
40.7 |
45.7 |
61.9 |
|
|
Developing country avg. (non-LDCs) |
75.7 |
73.6 |
73.4 |
75.5 |
76.7 |
77.0 |
78.4 |
77.5 |
78.5 |
|
|
Bangladesh |
|
|
|
|
|
|
30.1 |
30.1 |
|
|
|
The Gambia |
37.6 |
33.9 |
36.1 |
44.7 |
37.1 |
|
38.7 |
36.1 |
|
|
|
Kiribati |
|
|
|
26.4 |
|
25.7 |
25.5 |
|
|
|
|
Lesotho |
33.9 |
34.1 |
32.6 |
32.8 |
33.1 |
33.8 |
32.9 |
|
|
|
|
Malawi |
76.1 |
74.1 |
69.1 |
72.7 |
69.5 |
|
|
58.7 |
|
|
|
Mozambique |
55.4 |
54.8 |
54.9 |
54.8 |
54.7 |
53.6 |
52.4 |
55.3 |
|
|
|
Rwanda |
58.1 |
59.3 |
59.8 |
58.2 |
58.3 |
58.5 |
57.9 |
59.5 |
|
|
|
Sierra Leone |
31.3 |
33.0 |
34.8 |
|
33.8 |
37.3 |
39.4 |
27.5 |
|
|
|
Solomon Islands |
19.5 |
19.1 |
20.6 |
20.3 |
25.7 |
25.2 |
25.8 |
25.4 |
|
|
|
Tanzania |
|
45.8 |
43.4 |
43.1 |
|
41.8 |
47.2 |
50.6 |
|
|
|
Tuvalu |
|
|
|
|
12.7 |
17.2 |
|
15.6 |
|
|
|
Uganda |
47.8 |
48.8 |
45.6 |
|
42.9 |
42.7 |
42.7 |
|
|
|
|
Vanuatu |
|
|
22.8 |
|
26.6 |
|
|
|
|
|
|
Zambia |
55.9 |
49.2 |
|
41.0 |
42.7 |
43.3 |
42.1 |
|
|
|
|
CW LDC avg. |
46.2 |
45.2 |
42.0 |
43.8 |
39.7 |
37.9 |
39.5 |
39.9 |
|
|
|
Non-CW LDC avg. |
41.3 |
40.9 |
38.9 |
37.8 |
39.6 |
38.6 |
33.9 |
35.6 |
19.7 |
|
|
Developing country avg. (non-LDCs) |
21.9 |
22.0 |
19.8 |
20.2 |
20.5 |
20.5 |
19.8 |
19.6 |
22.1 |
|
|
Bangladesh |
30.6 |
32.2 |
35.2 |
|
|
36.2 |
34.0 |
35.1 |
|
|
|
The Gambia |
|
|
|
|
|
|
|
|
|
|
|
Kiribati |
|
|
|
|
|
|
|
|
|
|
|
Lesotho |
24.8 |
24.7 |
24.1 |
23.5 |
24.0 |
23.2 |
25.3 |
|
|
|
|
Malawi |
42.1 |
41.5 |
41.7 |
39.2 |
37.9 |
|
|
72.3 |
|
|
|
Mozambique |
33.2 |
33.1 |
41.5 |
40.0 |
39.7 |
|
36.5 |
|
|
|
|
Rwanda |
23.7 |
22.9 |
22.8 |
21.7 |
19.2 |
18.6 |
20.1 |
28.2 |
|
|
|
Sierra Leone |
20.5 |
21.7 |
20.7 |
|
20.5 |
22.0 |
|
|
|
|
|
Solomon Islands |
23.9 |
25.9 |
|
|
|
|
|
|
|
|
|
Tanzania |
|
|
|
23.5 |
|
15.9 |
17.1 |
20.9 |
|
|
|
Tuvalu |
|
|
|
|
6.2 |
8.4 |
|
8.6 |
|
|
|
Uganda |
|
|
|
|
|
|
|
|
|
|
|
Vanuatu |
|
|
|
|
20.6 |
|
|
|
|
|
|
Zambia |
|
|
|
|
|
|
|
|
|
|
|
CW LDC avg. |
28.4 |
28.9 |
31.0 |
29.6 |
24.0 |
20.7 |
26.6 |
33.0 |
|
|
|
Non-CW LDC avg. |
29.7 |
30.4 |
23.1 |
24.1 |
24.1 |
24.2 |
23.7 |
23.3 |
27.5 |
|
|
Developing country avg. (non-LDCs) |
16.2 |
16.6 |
15.8 |
15.8 |
15.8 |
16.1 |
15.6 |
14.7 |
11.4 |
|
|
Literacy rate, adult total (% of people ages 15 years and above)i |
||||||||||
|
Bangladesh |
58.8 |
57.9 |
61.0 |
61.1 |
65.1 |
72.8 |
72.9 |
73.9 |
74.7 |
|
|
The Gambia |
|
|
42.0 |
|
50.8 |
|
|
|
|
|
|
Kiribati |
|
|
|
|
|
|
|
|
|
|
|
Lesotho |
|
|
|
76.6 |
|
|
|
|
|
|
|
Malawi |
|
|
|
65.1 |
62.1 |
|
|
|
|
|
|
Mozambique |
|
|
|
|
56.0 |
|
60.7 |
|
|
|
|
Rwanda |
|
68.3 |
|
70.8 |
|
|
|
73.2 |
|
|
|
Sierra Leone |
|
|
32.4 |
|
|
|
|
43.2 |
|
|
|
Solomon Islands |
|
|
|
|
|
|
|
|
|
|
|
Tanzania |
|
78.1 |
|
|
77.9 |
|
|
|
|
|
|
Tuvalu |
|
|
|
|
|
|
|
|
|
|
|
Uganda |
|
70.2 |
|
|
|
|
|
76.5 |
|
|
|
Vanuatu |
|
|
|
84.7 |
|
|
|
87.5 |
|
|
|
Zambia |
|
|
|
|
|
|
|
86.7 |
|
|
|
CW LDC avg. |
58.8 |
68.6 |
45.1 |
71.7 |
62.4 |
72.8 |
66.8 |
73.5 |
|
|
|
Non-CW LDC avg. |
48.7 |
57.8 |
43.5 |
53.0 |
57.6 |
59.1 |
56.7 |
54.9 |
|
|
|
Developing country avg. (non-LDCs) |
90.4 |
87.1 |
90.1 |
90.3 |
94.3 |
94.3 |
92.4 |
90.7 |
|
|
|
Bangladesh |
78.0 |
77.8 |
85.5 |
85.6 |
87.9 |
92.2 |
93.0 |
93.3 |
94.9 |
|
|
The Gambia |
|
|
60.8 |
|
67.2 |
|
|
|
|
|
|
Kiribati |
|
|
|
|
|
|
|
|
|
|
|
Lesotho |
|
|
|
86.6 |
|
|
|
|
|
|
|
Malawi |
|
|
|
76.1 |
72.9 |
|
|
|
|
|
|
Mozambique |
|
|
|
|
70.5 |
|
70.9 |
|
|
|
|
Rwanda |
|
82.3 |
|
85.1 |
|
|
|
86.5 |
|
|
|
Sierra Leone |
|
|
57.0 |
|
|
|
|
66.6 |
|
|
|
Solomon Islands |
|
|
|
|
|
|
|
|
|
|
|
Tanzania |
|
85.9 |
|
|
85.8 |
|
|
|
|
|
|
Tuvalu |
|
|
|
|
|
|
|
|
|
|
|
Uganda |
|
83.7 |
|
|
|
|
|
89.4 |
|
|
|
Vanuatu |
|
|
|
95.3 |
|
|
|
96.3 |
|
|
|
Zambia |
|
|
|
|
|
|
|
92.1 |
|
|
|
CW LDC avg. |
78.0 |
82.4 |
67.8 |
85.7 |
76.9 |
92.2 |
81.9 |
87.4 |
|
|
|
Non-CW LDC avg. |
65.3 |
72.4 |
56.9 |
67.3 |
71.4 |
70.9 |
73.8 |
68.8 |
|
|
|
Developing country avg. (non-LDCs) |
95.9 |
94.1 |
96.1 |
95.5 |
98.7 |
98.4 |
97.1 |
95.9 |
|
|
|
Percentage of population living under the poverty line (US$1.90 a day)k |
||||||||||
|
Bangladesh |
|
19.4 |
|
|
|
|
|
14.5 |
|
|
|
The Gambia |
|
25.4 |
|
|
|
|
10.3 |
|
|
|
|
Lesotho |
|
|
|
|
|
|
|
|
27.8 |
|
|
Malawi |
|
72.3 |
|
|
|
|
|
70.8 |
|
|
|
Mozambique |
|
|
|
|
|
63.7 |
|
|
|
|
|
Rwanda |
|
63.2 |
|
|
57.9 |
|
|
56.5 |
|
|
|
Sierra Leone |
|
|
54.7 |
|
|
|
|
|
|
|
|
Solomon Islands |
|
|
|
|
25.1 |
|
|
|
|
|
|
Tanzania |
|
|
49.6 |
|
|
|
|
|
49.4 |
|
|
Tuvalu |
|
3.3 |
|
|
|
|
|
|
|
|
|
Uganda |
44.5 |
|
|
35.7 |
|
|
|
41.5 |
|
|
|
Vanuatu |
|
13.2 |
|
|
|
|
|
|
|
|
|
Zambia |
|
65.8 |
|
|
|
|
58.7 |
|
|
|
|
Bangladesh |
|
|
|
|
|
|
|
|
24.6 |
|
|
The Gambia |
|
|
|
|
|
|
|
41.6 |
|
|
|
Kiribati |
|
|
|
|
|
|
|
|
19.8 |
|
|
Lesotho |
|
|
|
|
|
|
|
19.6 |
|
|
|
Malawi |
|
|
|
|
|
52.6 |
|
|
|
|
|
Mozambique |
72.5 |
|
|
|
|
|
|
|
|
|
|
Rwanda |
|
|
|
|
54.4 |
|
|
|
|
|
|
Sierra Leone |
|
|
|
|
|
|
57.9 |
|
|
|
|
Solomon Islands |
|
|
|
|
|
|
|
|
|
|
|
Tanzania |
|
|
|
|
|
55.4 |
|
|
|
|
|
Uganda |
|
|
|
|
|
55.1 |
|
|
|
|
|
Vanuatu |
|
|
|
|
|
|
|
|
|
|
|
Zambia |
|
|
|
|
|
|
|
47.9 |
|
|
|
CW LDC avg. |
72.5 |
|
|
|
54.4 |
54.4 |
57.9 |
36.4 |
22.2 |
|
|
Non-CW LDC avg. |
|
63.9 |
55.3 |
44.7 |
68.2 |
51.4 |
45.9 |
67.0 |
|
|
|
Developing country avg. (non-LDCs) |
9.6 |
11.0 |
20.1 |
13.4 |
14.4 |
10.2 |
3.6 |
15.4 |
13.4 |
|
|
Bangladesh |
96.4 |
96.5 |
96.5 |
96.6 |
96.7 |
96.8 |
96.8 |
96.9 |
97.0 |
|
|
The Gambia |
76.4 |
76.6 |
76.8 |
77.0 |
77.2 |
77.4 |
77.7 |
77.8 |
78.0 |
|
|
Kiribati |
61.5 |
62.7 |
64.0 |
65.3 |
66.5 |
67.8 |
69.1 |
70.3 |
71.6 |
|
|
Lesotho |
67.9 |
68.0 |
68.1 |
68.2 |
68.3 |
68.4 |
68.5 |
68.6 |
68.6 |
|
|
Malawi |
61.4 |
62.3 |
63.3 |
64.2 |
65.1 |
66.1 |
67.0 |
67.9 |
68.8 |
|
|
Mozambique |
37.9 |
40.1 |
42.3 |
44.5 |
46.7 |
49.0 |
51.2 |
53.4 |
55.7 |
|
|
Rwanda |
52.1 |
52.8 |
53.4 |
54.1 |
54.8 |
55.5 |
56.3 |
57.0 |
57.7 |
|
|
Sierra Leone |
50.6 |
51.9 |
53.2 |
54.5 |
55.8 |
57.1 |
58.3 |
59.6 |
60.8 |
|
|
Solomon Islands |
74.4 |
73.5 |
72.6 |
71.8 |
70.9 |
70.1 |
69.3 |
68.5 |
67.8 |
|
|
Tanzania |
42.0 |
43.8 |
45.6 |
47.4 |
49.3 |
51.1 |
53.0 |
54.8 |
56.7 |
|
|
Tuvalu |
98.5 |
98.7 |
98.8 |
99.0 |
99.1 |
99.3 |
99.3 |
99.3 |
99.3 |
|
|
Uganda |
38.0 |
39.3 |
40.7 |
42.0 |
43.4 |
44.8 |
46.2 |
47.7 |
49.1 |
|
|
Vanuatu |
85.8 |
86.5 |
87.2 |
87.9 |
88.6 |
89.3 |
90.0 |
90.7 |
91.3 |
|
|
Zambia |
55.2 |
55.8 |
56.4 |
57.0 |
57.6 |
58.1 |
58.7 |
59.2 |
60.0 |
|
|
CW LDC avg. |
64.1 |
64.9 |
65.6 |
66.4 |
67.1 |
67.9 |
68.7 |
69.4 |
70.2 |
|
|
Non-CW LDC avg. |
58.7 |
59.7 |
60.0 |
60.9 |
61.8 |
62.7 |
63.6 |
64.5 |
66.2 |
|
|
Developing country avg. (non-LDCs) |
89.0 |
89.4 |
89.8 |
90.3 |
90.7 |
91.0 |
91.4 |
91.7 |
91.9 |
|
|
Bangladesh |
37.9 |
39.2 |
40.5 |
41.9 |
43.2 |
44.5 |
45.7 |
47.0 |
48.2 |
|
|
The Gambia |
45.3 |
44.1 |
43.0 |
41.9 |
40.9 |
39.9 |
39.0 |
39.1 |
39.2 |
|
|
Kiribati |
37.6 |
38.9 |
40.2 |
41.6 |
42.8 |
44.1 |
45.4 |
46.6 |
47.8 |
|
|
Lesotho |
28.1 |
30.0 |
31.9 |
33.7 |
35.5 |
37.3 |
39.1 |
40.8 |
42.8 |
|
|
Malawi |
23.7 |
24.0 |
24.3 |
24.6 |
24.9 |
25.3 |
25.6 |
25.9 |
26.2 |
|
|
Mozambique |
19.7 |
20.9 |
22.0 |
23.2 |
24.4 |
25.6 |
26.9 |
28.1 |
29.4 |
|
|
Rwanda |
57.0 |
58.3 |
59.5 |
60.7 |
61.9 |
63.1 |
64.2 |
65.4 |
66.6 |
|
|
Sierra Leone |
12.9 |
13.2 |
13.5 |
13.9 |
14.2 |
14.6 |
14.9 |
15.3 |
15.7 |
|
|
Solomon Islands |
25.9 |
26.9 |
27.8 |
28.8 |
29.8 |
30.8 |
31.8 |
32.8 |
33.5 |
|
|
Tanzania |
17.8 |
19.3 |
20.8 |
22.3 |
23.8 |
25.4 |
26.9 |
28.4 |
29.9 |
|
|
Tuvalu |
82.5 |
83.0 |
83.5 |
84.0 |
84.4 |
84.2 |
84.1 |
84.1 |
84.1 |
|
|
Uganda |
18.2 |
18.2 |
18.3 |
18.3 |
18.4 |
18.4 |
18.4 |
18.5 |
18.5 |
|
|
Vanuatu |
50.8 |
48.7 |
46.5 |
44.4 |
42.3 |
40.2 |
38.1 |
36.1 |
34.1 |
|
|
Zambia |
25.2 |
25.3 |
25.5 |
25.6 |
25.7 |
25.9 |
26.0 |
26.1 |
26.4 |
|
|
CW LDC avg. |
34.5 |
35.0 |
35.5 |
36.1 |
36.6 |
37.1 |
37.6 |
38.1 |
38.7 |
|
|
Non-CW LDC avg. |
29.8 |
30.7 |
30.9 |
31.8 |
32.7 |
33.6 |
34.5 |
35.4 |
37.3 |
|
|
Developing country avg. (non-LDCs) |
78.2 |
78.9 |
79.5 |
80.1 |
80.7 |
81.2 |
81.7 |
82.0 |
82.3 |
|
|
Bangladesh |
22.8 |
23.5 |
26.7 |
29.7 |
32.8 |
34.6 |
37.4 |
41.9 |
|
|
|
The Gambia |
33.1 |
31.4 |
27.4 |
22.5 |
21.0 |
21.8 |
22.7 |
22.2 |
|
|
|
Kiribati |
148.8 |
154.0 |
162.5 |
163.0 |
123.3 |
147.8 |
175.1 |
196.8 |
|
|
|
Lesotho |
125.0 |
117.1 |
116.8 |
113.7 |
103.6 |
89.4 |
111.6 |
124.8 |
|
|
|
Malawi |
40.1 |
33.2 |
40.3 |
36.1 |
35.7 |
30.9 |
34.0 |
35.5 |
|
|
|
Mozambique |
29.3 |
34.5 |
40.7 |
42.5 |
39.6 |
30.7 |
35.9 |
40.3 |
|
|
|
Rwanda |
53.1 |
58.9 |
49.1 |
51.9 |
50.0 |
51.9 |
52.9 |
58.3 |
|
|
|
Sierra Leone |
59.5 |
60.0 |
82.9 |
141.0 |
120.9 |
87.1 |
82.5 |
85.8 |
|
|
|
Solomon Islands |
115.5 |
106.2 |
106.4 |
114.4 |
99.4 |
99.3 |
97.4 |
95.0 |
|
|
|
Tanzania |
38.0 |
42.3 |
43.8 |
40.2 |
33.6 |
37.2 |
35.5 |
36.8 |
|
|
|
Tuvalu |
567.5 |
532.0 |
628.6 |
568.0 |
531.3 |
547.9 |
633.4 |
692.5 |
|
|
|
Uganda |
56.3 |
56.0 |
52.2 |
52.9 |
43.7 |
42.2 |
42.0 |
43.1 |
|
|
|
Vanuatu |
114.2 |
118.0 |
129.8 |
106.7 |
116.5 |
82.2 |
85.1 |
105.4 |
|
|
|
Zambia |
57.9 |
69.3 |
88.1 |
67.5 |
59.3 |
57.4 |
67.5 |
76.0 |
|
|
|
CW LDC avg. |
104.4 |
102.6 |
114.0 |
110.7 |
100.8 |
97.2 |
108.1 |
118.2 |
|
|
|
Non-CW LDC avg. |
49.7 |
49.1 |
54.5 |
56.6 |
55.9 |
55.1 |
56.6 |
52.8 |
|
|
|
Developing country avg. (non-LDCs) |
454.5 |
484.7 |
511.6 |
532.4 |
522.7 |
525.5 |
559.6 |
568.5 |
|
|
|
Bangladesh |
0.2 |
0.2 |
0.2 |
0.3 |
0.3 |
0.3 |
0.3 |
0.4 |
|
|
|
The Gambia |
|
1.3 |
|
|
1.5 |
|
|
|
|
|
|
Kiribati |
3.9 |
|
4.6 |
|
|
4.8 |
|
3.8 |
|
|
|
Lesotho |
|
|
|
|
|
|
|
3.3 |
|
|
|
Malawi |
|
|
|
|
|
0.3 |
|
0.4 |
|
|
|
Mozambique |
0.4 |
0.4 |
0.7 |
0.6 |
0.6 |
0.7 |
0.7 |
0.7 |
|
|
|
Rwanda |
0.7 |
|
|
0.9 |
1.0 |
1.2 |
1.1 |
1.2 |
|
|
|
Sierra Leone |
0.3 |
|
|
1.0 |
|
0.2 |
|
|
|
|
|
Solomon Islands |
1.8 |
1.7 |
2.0 |
|
|
2.1 |
|
2.2 |
|
|
|
Tanzania |
|
0.4 |
|
0.4 |
|
|
0.6 |
|
|
|
|
Tuvalu |
|
|
|
3.8 |
|
|
|
4.3 |
|
|
|
Uganda |
|
1.2 |
1.3 |
1.2 |
1.6 |
1.6 |
1.5 |
1.2 |
|
|
|
Vanuatu |
|
1.8 |
|
|
|
1.4 |
|
1.4 |
|
|
|
Zambia |
|
|
|
|
|
0.9 |
1.3 |
1.3 |
|
|
|
CW LDC avg. |
1.2 |
1.0 |
1.8 |
1.2 |
1.0 |
1.4 |
0.9 |
1.8 |
|
|
|
Non-CW LDC avg. |
0.7 |
0.8 |
0.8 |
0.8 |
0.7 |
0.7 |
1.0 |
1.0 |
|
|
|
Developing country avg. (non-LDCs) |
3.2 |
3.5 |
5.7 |
5.9 |
5.8 |
6.0 |
5.8 |
3.5 |
|
|
|
Bangladesh |
0.4 |
0.4 |
0.4 |
0.5 |
0.5 |
0.5 |
0.5 |
0.6 |
|
|
|
The Gambia |
|
|
|
|
0.1 |
|
|
|
|
|
|
Kiribati |
0.1 |
|
0.2 |
|
|
|
|
|
|
|
|
Lesotho |
|
|
|
|
|
|
|
|
|
|
|
Malawi |
|
|
|
|
|
0.0 |
|
0.0 |
|
|
|
Mozambique |
0.1 |
0.1 |
0.1 |
|
0.0 |
0.0 |
0.1 |
0.1 |
|
|
|
Rwanda |
0.0 |
|
0.1 |
0.1 |
0.1 |
0.1 |
0.1 |
0.1 |
|
|
|
Sierra Leone |
0.0 |
|
|
|
|
|
|
|
|
|
|
Solomon Islands |
0.2 |
0.2 |
0.2 |
|
|
0.2 |
|
|
|
|
|
Tanzania |
|
0.0 |
|
0.1 |
|
0.0 |
|
|
|
|
|
Tuvalu |
|
|
|
0.9 |
|
|
|
|
|
|
|
Uganda |
|
0.1 |
|
|
0.1 |
|
0.2 |
|
|
|
|
Vanuatu |
|
0.2 |
|
|
|
0.2 |
|
|
|
|
|
Zambia |
0.2 |
0.2 |
|
|
|
0.2 |
|
1.2 |
|
|
|
CW LDC avg. |
0.1 |
0.2 |
0.2 |
0.4 |
0.2 |
0.2 |
0.2 |
0.4 |
|
|
|
Non-CW LDC avg. |
0.2 |
0.2 |
0.2 |
0.3 |
0.2 |
0.1 |
0.3 |
0.3 |
|
|
|
Developing country avg. (non-LDCs) |
1.7 |
1.7 |
1.8 |
1.9 |
1.8 |
1.7 |
1.9 |
1.9 |
|
|
|
Bangladesh |
70.3 |
70.6 |
70.9 |
71.2 |
71.5 |
71.8 |
72.1 |
72.3 |
72.6 |
|
|
The Gambia |
59.9 |
60.2 |
60.4 |
60.7 |
60.9 |
61.2 |
61.4 |
61.7 |
62.1 |
|
|
Kiribati |
66.1 |
66.4 |
66.7 |
67.0 |
67.3 |
67.6 |
67.9 |
68.1 |
68.4 |
|
|
Lesotho |
46.2 |
47.4 |
48.7 |
49.9 |
51.0 |
52.1 |
52.9 |
53.7 |
54.3 |
|
|
Malawi |
57.2 |
58.6 |
59.9 |
61.0 |
62.0 |
62.7 |
63.3 |
63.8 |
64.3 |
|
|
Mozambique |
53.0 |
53.9 |
54.9 |
56.1 |
57.2 |
58.3 |
59.3 |
60.2 |
60.9 |
|
|
Rwanda |
64.5 |
65.4 |
66.2 |
66.9 |
67.5 |
67.9 |
68.3 |
68.7 |
69.0 |
|
|
Sierra Leone |
50.2 |
51.0 |
51.7 |
52.4 |
52.9 |
53.4 |
53.9 |
54.3 |
54.7 |
|
|
Solomon Islands |
71.0 |
71.3 |
71.6 |
71.9 |
72.2 |
72.4 |
72.6 |
72.8 |
73.0 |
|
|
Tanzania |
59.5 |
60.5 |
61.4 |
62.3 |
63.1 |
63.8 |
64.5 |
65.0 |
65.5 |
|
|
Tuvalu |
|
|
|
|
|
|
|
|
|
|
|
Uganda |
58.1 |
59.0 |
59.9 |
60.7 |
61.4 |
62.0 |
62.5 |
63.0 |
63.4 |
|
|
Vanuatu |
69.3 |
69.4 |
69.6 |
69.7 |
69.9 |
70.0 |
70.2 |
70.3 |
70.5 |
|
|
Zambia |
57.1 |
58.5 |
59.7 |
60.8 |
61.7 |
62.5 |
63.0 |
63.5 |
63.9 |
|
|
CW LDC avg. |
60.2 |
60.9 |
61.7 |
62.3 |
63.0 |
63.5 |
64.0 |
64.4 |
64.8 |
|
|
Non-CW LDC avg. |
60.7 |
61.1 |
61.6 |
62.1 |
62.5 |
62.9 |
63.2 |
63.6 |
63.9 |
|
|
Developing country avg. (non-LDCs) |
70.8 |
71.1 |
71.4 |
71.7 |
72.0 |
72.2 |
72.5 |
72.6 |
72.9 |
|
|
Bangladesh |
36.8 |
35.1 |
33.5 |
32.1 |
30.6 |
29.3 |
28.0 |
26.7 |
25.6 |
|
|
The Gambia |
44.2 |
43.1 |
41.9 |
40.8 |
39.8 |
38.8 |
37.8 |
36.8 |
35.9 |
|
|
Kiribati |
48.5 |
47.6 |
46.7 |
45.6 |
44.6 |
43.5 |
42.3 |
41.3 |
40.1 |
|
|
Lesotho |
71.7 |
72.2 |
72.1 |
71.6 |
71.9 |
72.3 |
71.7 |
69.1 |
68.1 |
|
|
Malawi |
49.5 |
45.9 |
42.7 |
39.7 |
37.3 |
35.3 |
33.5 |
32.1 |
30.9 |
|
|
Mozambique |
68.8 |
66.4 |
64.7 |
63.2 |
61.5 |
59.8 |
57.9 |
56.4 |
54.8 |
|
|
Rwanda |
39.8 |
37.0 |
34.5 |
32.5 |
30.9 |
29.6 |
28.4 |
27.3 |
26.3 |
|
|
Sierra Leone |
103.5 |
100.2 |
97.0 |
94.9 |
94.2 |
88.6 |
85.9 |
83.4 |
80.9 |
|
|
Solomon Islands |
21.3 |
20.7 |
20.1 |
19.6 |
19.0 |
18.4 |
17.9 |
17.3 |
16.8 |
|
|
Tanzania |
45.7 |
44.3 |
43.1 |
42.0 |
41.0 |
39.8 |
38.3 |
37.0 |
36.0 |
|
|
Tuvalu |
25.7 |
25.0 |
24.3 |
23.6 |
22.9 |
22.2 |
21.5 |
20.9 |
20.2 |
|
|
Uganda |
47.6 |
44.6 |
42.9 |
40.9 |
39.2 |
37.6 |
36.0 |
34.6 |
33.4 |
|
|
Vanuatu |
24.8 |
24.9 |
24.7 |
24.4 |
24.0 |
23.5 |
22.9 |
22.4 |
21.9 |
|
|
Zambia |
51.0 |
49.9 |
48.7 |
47.5 |
46.7 |
45.8 |
44.1 |
43.4 |
42.4 |
|
|
CW LDC avg. |
48.5 |
46.9 |
45.5 |
44.2 |
43.1 |
41.8 |
40.4 |
39.2 |
38.1 |
|
|
Non-CW LDC avg. |
58.7 |
56.9 |
55.3 |
53.7 |
52.3 |
50.9 |
49.6 |
48.3 |
47.1 |
|
|
Developing country avg. (non-LDCs) |
22.8 |
22.2 |
21.6 |
21.0 |
20.4 |
19.9 |
19.4 |
18.9 |
18.4 |
|
|
Bangladesh |
0.618 |
0.717 |
0.719 |
0.74 |
0.69 |
0.69 |
0.654 |
0.622 |
0.614 |
0.622 |
|
The Gambia |
0.586 |
0.586 |
0.585 |
0.571 |
0.584 |
0.586 |
0.618 |
0.579 |
0.68 |
0.782 |
|
Lesotho |
0.838 |
0.841 |
0.841 |
0.83 |
0.811 |
0.813 |
0.818 |
0.823 |
0.748 |
0.806 |
|
Malawi |
0.744 |
0.761 |
0.761 |
0.767 |
0.75 |
0.688 |
0.746 |
0.715 |
0.69 |
0.725 |
|
Mozambique |
0.811 |
0.846 |
0.862 |
0.809 |
0.831 |
0.799 |
0.801 |
0.851 |
0.796 |
0.799 |
|
Rwanda |
0.844 |
0.896 |
0.852 |
0.866 |
0.881 |
0.888 |
0.888 |
0.815 |
0.853 |
0.849 |
|
Sierra Leone |
0.701 |
0.772 |
0.772 |
0.76 |
0.815 |
0.815 |
0.815 |
0.828 |
0.765 |
0.833 |
|
Solomon Islands |
0.466 |
0.474 |
0.474 |
0.487 |
0.474 |
0.487 |
0.489 |
0.492 |
0.51 |
0.489 |
|
Tanzania |
0.79 |
0.807 |
0.807 |
0.807 |
0.807 |
0.781 |
0.786 |
0.814 |
0.838 |
0.778 |
|
Uganda |
0.86 |
0.886 |
0.857 |
0.848 |
0.814 |
0.827 |
0.796 |
0.834 |
0.831 |
0.784 |
|
Vanuatu |
0.768 |
0.766 |
0.766 |
0.74 |
0.74 |
0.74 |
0.748 |
0.748 |
0.702 |
0.743 |
|
Zambia |
0.72 |
0.739 |
0.724 |
0.718 |
0.692 |
0.704 |
0.7 |
0.736 |
0.801 |
0.761 |
|
CW LDC avg. |
0.73 |
0.76 |
0.75 |
0.75 |
0.74 |
0.73 |
0.74 |
0.74 |
0.74 |
0.75 |
|
Non-CW LDC avg. |
0.59 |
0.61 |
0.61 |
0.62 |
0.62 |
0.62 |
0.63 |
0.63 |
0.63 |
0.63 |
|
Developing country avg. (non-LDCs) |
0.67 |
0.68 |
0.68 |
0.69 |
0.69 |
0.69 |
0.70 |
0.70 |
0.70 |
0.70 |
|
Proportion of population covered by at least one social protection benefit (%)u |
||||||||||
|
|
|
|
|
|
28.4 |
|
|
|
|
|
|
The Gambia |
|
|
|
|
|
6.1 |
|
|
|
6.1 |
|
Kiribati |
|
|
|
|
|
|
|
|
|
21.0 |
|
Lesotho |
|
|
|
|
|
9.2 |
|
|
|
9.2 |
|
Malawi |
|
|
|
|
|
21.3 |
|
|
|
21.3 |
|
Mozambique |
|
|
|
|
|
10.9 |
|
|
|
13.4 |
|
Rwanda |
|
|
|
|
|
|
|
|
|
8.9 |
|
Sierra Leone |
|
|
|
|
|
|
|
|
|
4.4 |
|
Solomon Islands |
|
|
|
|
|
|
|
|
1.1 |
|
|
Tanzania |
|
|
|
|
|
|
|
|
4.0 |
14.0 |
|
Uganda |
|
|
|
|
|
2.9 |
|
|
|
2.8 |
|
Vanuatu |
|
|
|
|
|
|
|
|
|
57.4 |
|
Zambia |
|
|
|
|
|
15.3 |
|
|
|
24.6 |
|
CW LDC avg. |
|
|
|
|
|
13.4 |
|
|
2.6 |
16.6 |
|
Non-CW LDC avg. |
|
|
|
|
|
13.5 |
|
|
39.3 |
44.1 |
|
Developing country avg. (non-LDCs) |
|
|
|
|
|
39.4 |
|
|
35.6 |
42.3 |
|
Governance at all levels |
||||||||||
|
CPIA transparency, accountability, and corruption in the public sector ratingv |
||||||||||
|
Bangladesh |
2.5 |
2.5 |
2.5 |
2.5 |
2.5 |
2.5 |
2.5 |
2.5 |
2.5 |
|
|
The Gambia |
2.5 |
2.0 |
2.0 |
2.0 |
2.0 |
2.0 |
2.0 |
2.5 |
2.5 |
|
|
Kiribati |
3.5 |
3.5 |
3.5 |
3.5 |
3.5 |
3.5 |
3.5 |
3.5 |
3.5 |
|
|
Lesotho |
3.5 |
3.5 |
3.5 |
3.0 |
3.0 |
3.0 |
3.0 |
3.0 |
3.0 |
|
|
Malawi |
3.0 |
3.0 |
2.5 |
2.5 |
2.5 |
2.5 |
2.5 |
2.5 |
2.5 |
|
|
Mozambique |
3.0 |
3.0 |
3.0 |
3.0 |
2.5 |
2.5 |
2.5 |
2.5 |
2.5 |
|
|
Rwanda |
3.5 |
3.5 |
3.5 |
3.5 |
3.5 |
3.5 |
3.5 |
3.5 |
3.5 |
|
|
Sierra Leone |
3.0 |
3.0 |
3.0 |
3.0 |
3.0 |
3.0 |
3.0 |
3.0 |
3.0 |
|
|
Solomon Islands |
3.0 |
3.0 |
3.0 |
3.0 |
3.0 |
3.0 |
3.0 |
3.0 |
3.0 |
|
|
Tanzania |
3.0 |
3.0 |
3.0 |
3.0 |
3.0 |
3.0 |
3.0 |
2.5 |
3.0 |
|
|
Tuvalu |
|
3.0 |
3.0 |
3.5 |
3.5 |
3.5 |
3.5 |
3.5 |
3.5 |
|
|
Uganda |
2.5 |
2.0 |
2.0 |
2.0 |
2.0 |
2.0 |
2.0 |
2.5 |
2.5 |
|
|
Vanuatu |
3.0 |
3.5 |
3.5 |
3.0 |
3.0 |
3.0 |
3.0 |
3.0 |
3.0 |
|
|
Zambia |
2.5 |
3.0 |
3.0 |
3.0 |
3.0 |
3.0 |
3.0 |
2.5 |
2.5 |
|
|
CW LDC avg. |
3.0 |
3.0 |
2.9 |
2.9 |
2.9 |
2.9 |
2.9 |
2.9 |
2.9 |
|
|
Non-CW LDC avg. |
2.7 |
2.6 |
2.6 |
2.7 |
2.6 |
2.6 |
2.5 |
2.6 |
2.6 |
|
|
Developing country avg. (non-LDCs) |
3.1 |
3.2 |
3.2 |
3.2 |
3.2 |
3.2 |
3.2 |
3.2 |
3.2 |
|
|
Bangladesh |
3.0 |
3.0 |
3.0 |
3.0 |
3.0 |
3.0 |
3.0 |
3.0 |
3.0 |
|
|
The Gambia |
3.5 |
3.5 |
3.5 |
3.5 |
3.0 |
3.0 |
3.0 |
3.0 |
3.0 |
|
|
Kiribati |
3.0 |
3.0 |
3.0 |
2.5 |
2.5 |
2.5 |
2.5 |
2.5 |
2.5 |
|
|
Lesotho |
3.5 |
3.5 |
2.5 |
3.0 |
3.0 |
3.0 |
3.0 |
2.5 |
2.5 |
|
|
Malawi |
3.0 |
3.0 |
2.5 |
3.0 |
3.0 |
3.5 |
3.5 |
3.5 |
3.0 |
|
|
Mozambique |
4.0 |
4.0 |
4.0 |
4.0 |
4.0 |
4.0 |
3.5 |
3.5 |
3.5 |
|
|
Rwanda |
4.0 |
4.0 |
4.0 |
4.0 |
4.0 |
4.0 |
4.0 |
4.0 |
4.0 |
|
|
Sierra Leone |
3.5 |
3.5 |
3.5 |
3.5 |
3.5 |
3.5 |
3.5 |
3.5 |
3.5 |
|
|
Solomon Islands |
3.0 |
3.0 |
2.5 |
2.5 |
2.5 |
2.5 |
2.5 |
2.5 |
2.5 |
|
|
Tanzania |
3.0 |
3.0 |
3.5 |
3.5 |
3.0 |
3.0 |
3.0 |
3.0 |
3.0 |
|
|
Tuvalu |
|
3.0 |
3.0 |
3.0 |
3.5 |
3.5 |
3.5 |
3.0 |
3.0 |
|
|
Uganda |
3.5 |
3.0 |
3.0 |
3.5 |
3.5 |
3.0 |
3.0 |
3.5 |
3.5 |
|
|
Vanuatu |
4.0 |
4.0 |
4.0 |
4.0 |
3.5 |
3.5 |
3.5 |
3.5 |
3.0 |
|
|
Zambia |
3.5 |
3.5 |
3.5 |
3.5 |
3.5 |
3.5 |
3.5 |
3.5 |
3.0 |
|
|
CW LDC avg. |
3.4 |
3.4 |
3.3 |
3.3 |
3.3 |
3.3 |
3.2 |
3.2 |
3.1 |
|
|
Non-CW LDC avg. |
3.0 |
2.9 |
3.0 |
3.0 |
3.0 |
3.0 |
2.9 |
2.9 |
2.8 |
|
|
Developing country avg. (non-LDCs) |
3.4 |
3.4 |
3.4 |
3.3 |
3.3 |
3.2 |
3.3 |
3.2 |
3.3 |
|
|
Proportion of seats held by women in national parliament (%)x |
||||||||||
|
Bangladesh |
19.7 |
19.7 |
19.7 |
19.8 |
20.0 |
20.0 |
20.3 |
20.3 |
20.6 |
20.9 |
|
The Gambia |
7.5 |
7.5 |
7.5 |
9.4 |
9.4 |
9.4 |
10.3 |
10.3 |
10.3 |
8.6 |
|
Kiribati |
8.7 |
8.7 |
8.7 |
8.7 |
8.7 |
6.5 |
6.5 |
6.5 |
6.5 |
8.9 |
|
Lesotho |
24.2 |
26.7 |
26.7 |
26.7 |
25.0 |
25.0 |
22.1 |
22.1 |
23.3 |
23.3 |
|
Malawi |
22.3 |
22.3 |
22.3 |
16.7 |
16.7 |
16.7 |
16.7 |
16.7 |
22.9 |
22.9 |
|
Mozambique |
39.2 |
39.2 |
39.2 |
|
39.6 |
39.6 |
39.6 |
39.6 |
41.2 |
42.4 |
|
Rwanda |
56.3 |
56.3 |
63.8 |
63.8 |
63.8 |
63.8 |
61.3 |
61.3 |
61.3 |
61.3 |
|
Sierra Leone |
12.9 |
12.4 |
12.4 |
12.1 |
12.4 |
12.4 |
12.4 |
12.3 |
12.3 |
12.3 |
|
Solomon Islands |
0.0 |
2.0 |
2.0 |
2.0 |
2.0 |
2.0 |
2.0 |
2.0 |
4.1 |
6.4 |
|
Tanzania |
36.0 |
36.0 |
36.0 |
36.0 |
36.0 |
36.6 |
37.2 |
37.2 |
36.9 |
36.7 |
|
Tuvalu |
6.7 |
6.7 |
6.7 |
6.7 |
6.7 |
6.7 |
6.7 |
6.7 |
6.3 |
6.3 |
|
Uganda |
35.0 |
35.0 |
35.0 |
35.0 |
35.0 |
33.5 |
34.3 |
34.3 |
34.9 |
34.9 |
|
Vanuatu |
1.9 |
0.0 |
0.0 |
0.0 |
0.0 |
0.0 |
0.0 |
0.0 |
0.0 |
0.0 |
|
Zambia |
11.5 |
11.5 |
11.5 |
10.8 |
12.7 |
18.0 |
18.0 |
18.0 |
18.0 |
16.8 |
|
CW LDC avg. |
20.1 |
20.3 |
20.8 |
19.0 |
20.6 |
20.7 |
20.5 |
20.5 |
21.3 |
21.5 |
|
Non-CW LDC avg. |
17.0 |
18.1 |
18.0 |
18.9 |
19.4 |
19.1 |
19.0 |
19.5 |
19.6 |
21.4 |
|
Developing country avg. (non-LDCs) |
15.0 |
15.9 |
17.1 |
17.6 |
18.1 |
18.6 |
19.1 |
19.9 |
20.5 |
21.4 |
Sources: a,c,e,f,g,h,I,j,k,o,p,q,r,s,v,w,x World Bank World Development Indicators; b,d,l United Nations Development Programme Human Development Data Center; m,n World Health Organization/United Nations Children’s Fund Joint Monitoring Programme for Water Supply, Sanitation and Hygiene data; t Varieties of Democracy (V-Dem) Institute, Data Center, version 11; u UN Stat SDG Indicators
Table A2: Changes in LDC exports between 2011 and 2020, by region and sector
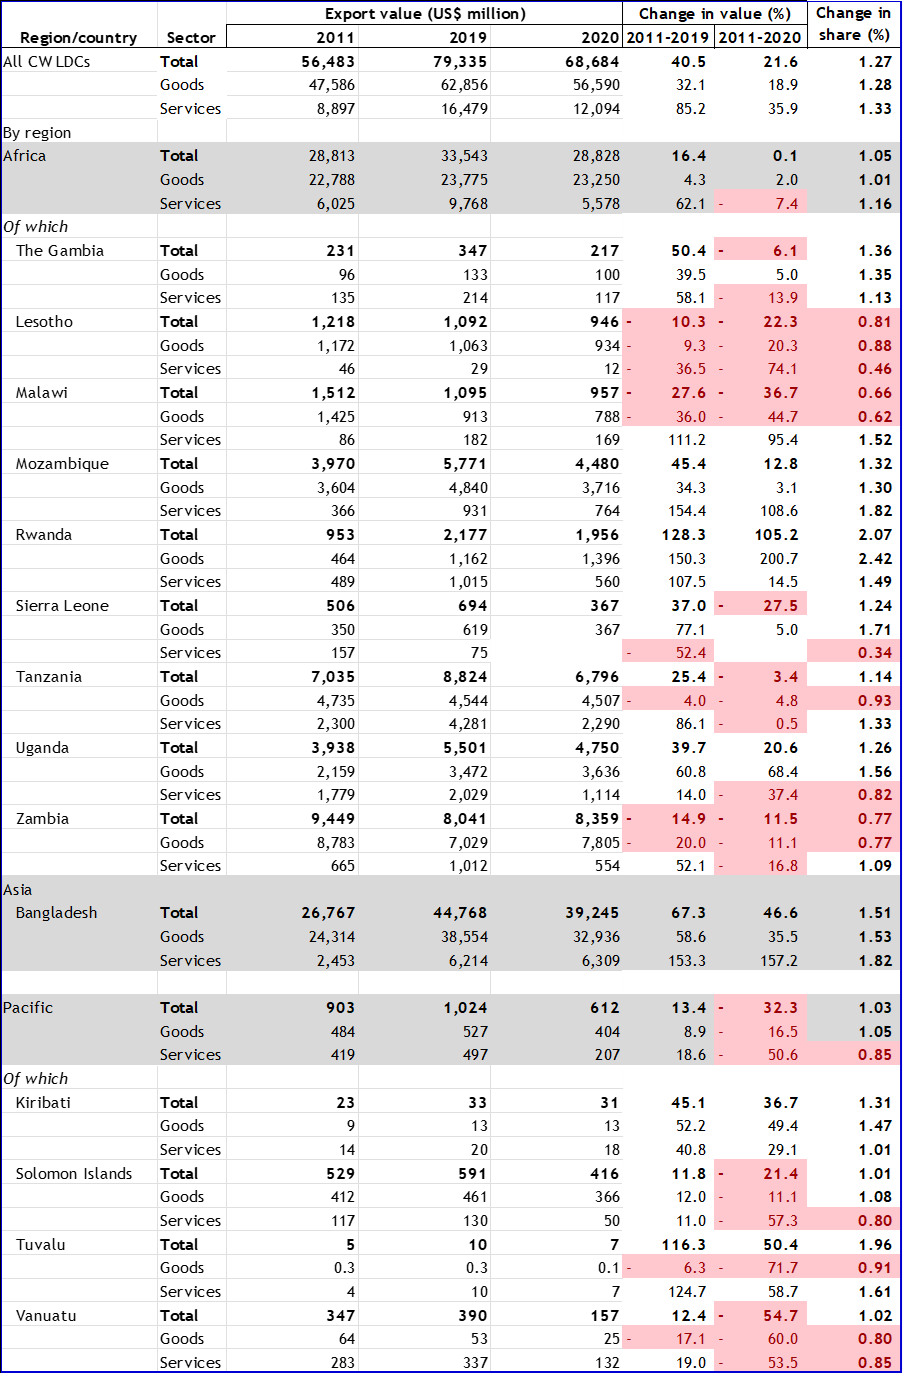
Table A3: Regional and sectoral distribution of LDC exports, 2019
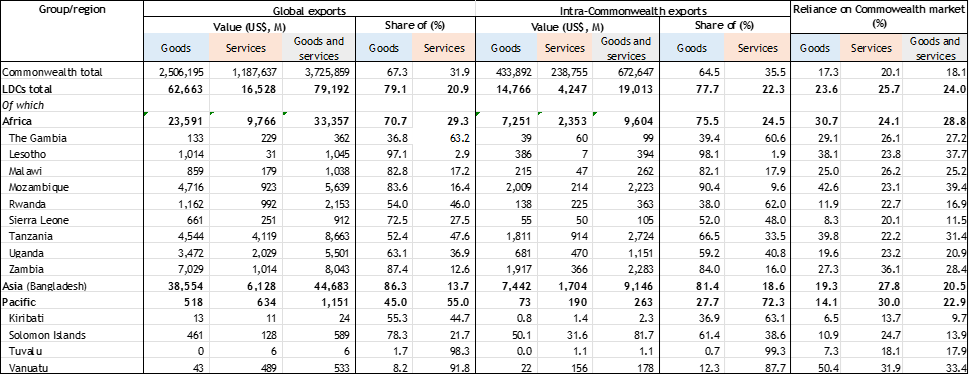
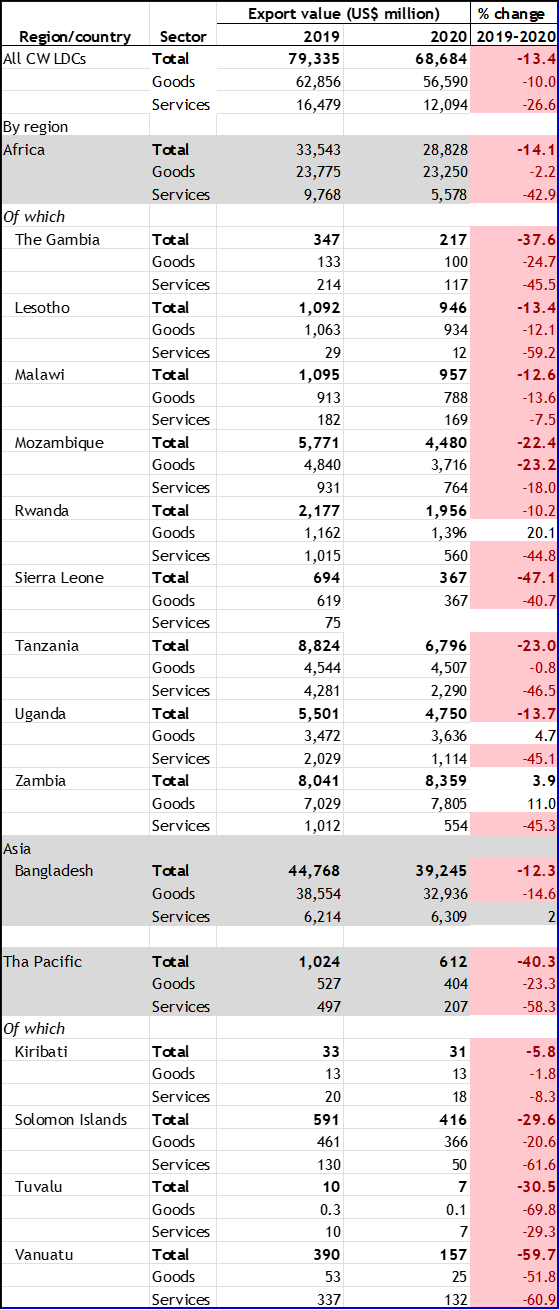
Table A4: Effect of the COVID-19 pandemic on Commonwealth LDCs’ exports, 2019-2020