
Despite operating in a challenging global context, the IPoA is generally regarded as the most successful of the four programmes of action implemented to date (UNCTAD, 2021c). Compared with its predecessors, the IPoA placed greater emphasis on practical actions to build productive capacity in LDCs and diversify their economies.
This is evident from the IPoA’s eight priority areas, detailed in Table 1, the majority of which either directly address the need to enhance productive capabilities and expand trade, or seek to improve various aspects of the broader environment that can facilitate a shift to a more productive and sustainable development path. To help operationalise these priorities, 41 goals and 251 actions were devised under the IPoA (UN-OHRLLS, 2020).
Table 1: Priority areas in the Istanbul Programme of Action for the Least Developed Countries 2011-2020
|
Priority areas |
Focus (if applicable) |
Selected examples of linked goals |
Selected examples of specific targets |
|
Agriculture, food security and rural development |
|
|
|
|
Commodities |
|
|
|
|
Human and social development |
|
|
Universal access to free primary education |
|
Governance at all levels |
|
|
|
|
Mobilising financial resources for development and capacity-building |
|
|
Developed countries to provide 0.15–0.20 per cent of ODA/gross national income to LDCs |
|
Multiple crises and other emerging challenges |
|
|
|
|
Productive capacity |
|
|
Sustained, equitable and inclusive economic growth of at least 7 per cent per annum Doubled manufacturing value added share in gross domestic product in LDCs Universal internet access by 2020 Increased total primary energy supply per capita to the same level as other developing countries |
|
Trade |
|
|
Doubled share of LDCs in global exports by 2020 |
Sources: Compiled based on information in Razzaque and Selvakumar (2017), Schroderus-Fox (2017), UNESCAP (2021), UNECA (2020), UNIDO and UN-OHRLLS (2019), UN-OHRLLS (2020, 2021), ECOSOC (2021a)
This chapter assesses the progress Commonwealth LDCs made in building productive capacity and advancing economic transformation under the IPoA. It concludes with a summary of outstanding issues and challenges that continue to constrain productive development and economic transformation in Commonwealth LDCs. Both the trade and broader economic and financial impacts of the COVID-19 pandemic, which have undoubtedly slowed the progress of Commonwealth LDCs and potentially derailed gains achieved during the preceding years of the IPoA, are considered separately in Chapter 5.
2.1 Commonwealth LDCs’ progress in IPoA priority areas related to productive capacity
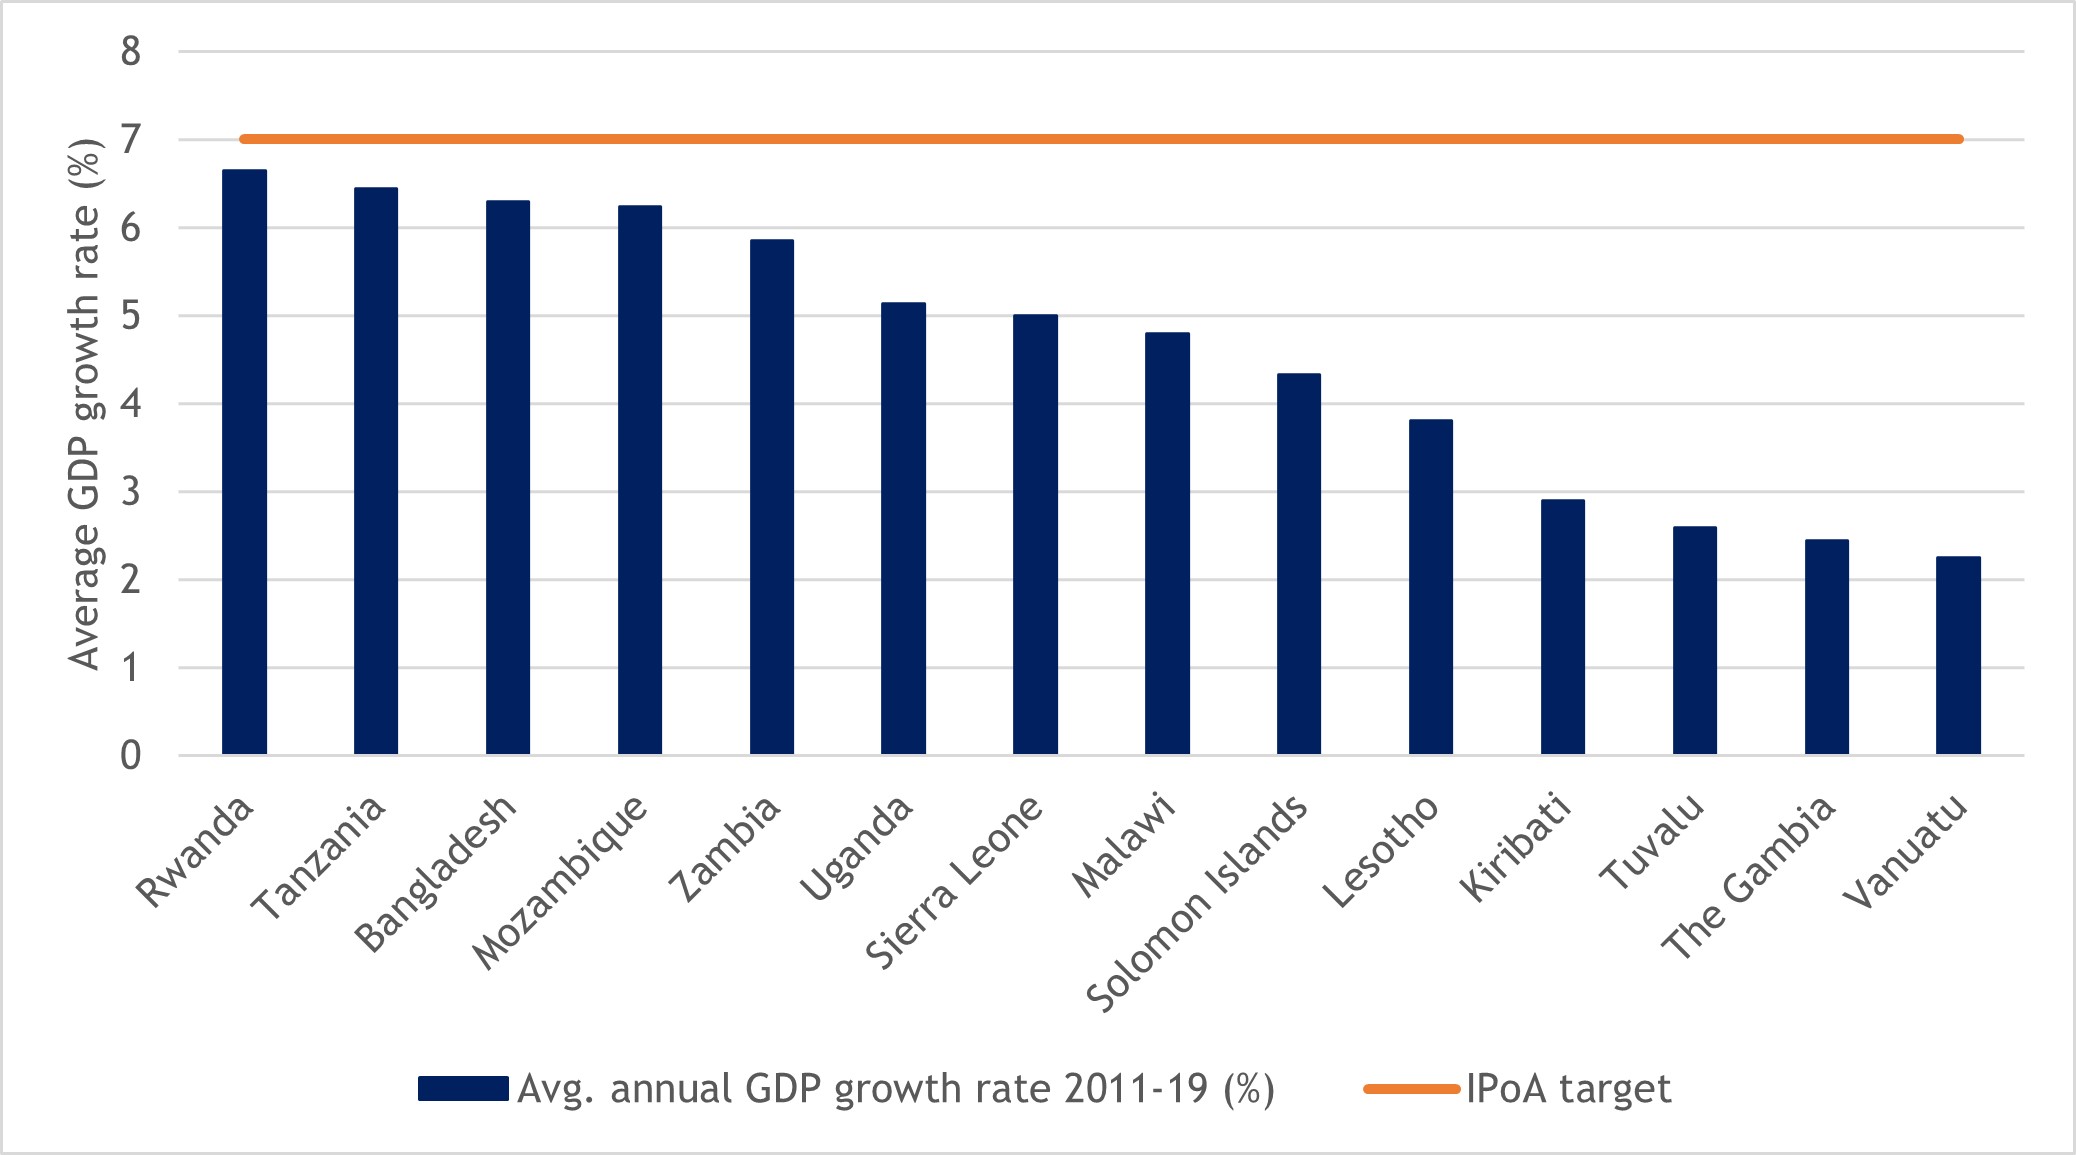
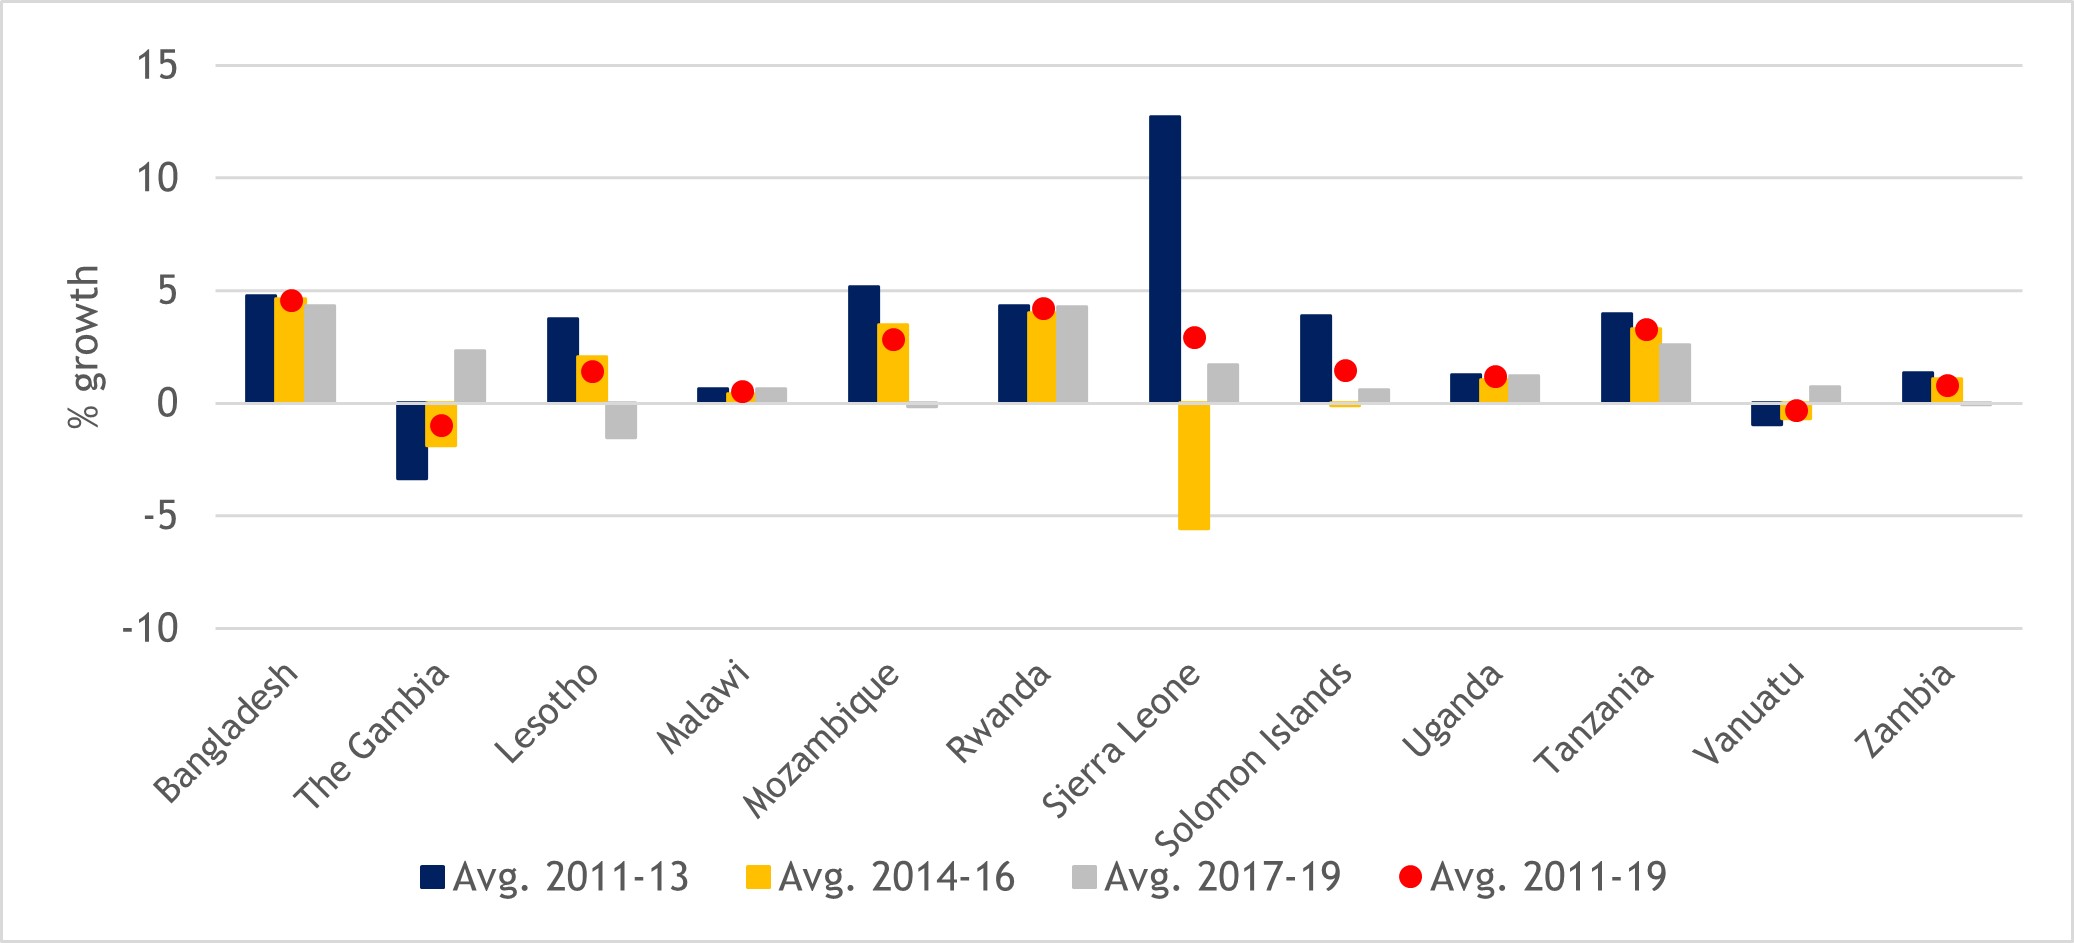
Growth in gross domestic product (GDP) provides a broad indicator of the rate of expansion of productive activity in an economy. A major overarching target of the IPoA was for LDCs to attain sustained, equitable and inclusive economic growth, reflected in GDP growth rates of at least 7 per cent per annum. Unfortunately, achieving such growth has proven challenging for Commonwealth LDCs over much of the past decade. Collectively, their annual GDP growth rates averaged 4.6 per cent between 2011 and 2019, marginally lower than the average (4.8 per cent) for all other LDCs.
As Figure 1 shows, none of the 14 Commonwealth LDCs reached the IPoA growth target when considering average annual GDP growth rates across the whole period from 2011 to 2019. Rwanda, Tanzania, Bangladesh and Mozambique came closest, with annual averages exceeding 6 per cent over the nine-year period, but average growth rates in Lesotho, Kiribati, Tuvalu and Vanuatu fell well short of the target. Several Commonwealth LDCs managed to record GDP growth exceeding the 7 per cent target in particular years. Mozambique, for example, recorded four consecutive years of above-target growth between 2013 and 2016; and Rwanda did so for three consecutive years between 2012 and 2014, followed by a peak of 8.9 per cent in 2017. Bangladesh rallied in the latter part of the period, registering above 7 per cent growth in 2018 and 2019. Zambia recorded strong GDP growth rates – mostly above the 7 per cent target – in the first half of the IPoA implementation period, before growth slowed considerably.
Five Commonwealth LDCs (Kiribati, Malawi, Solomon Islands, Tanzania and Uganda) reached or exceeded the 7 per cent growth target in only a single year between 2011 and 2019. Growth rates were even more subdued in Vanuatu, along with two African LDCs (The Gambia and Lesotho), which did not manage to reach the IPoA growth target in any of the years between 2011 and 2019.
Volatile economic growth was a feature for many Commonwealth LDCs over this period. This was especially so in the case of Sierra Leone, where GDP growth rates of 15.2 and 20.7 per cent in 2014 and 2015 were followed by a contraction of 20.5 per cent in 2017. Frequent and large swings in GDP growth rates between years were also observed in The Gambia, Kiribati and Tuvalu.
Figure 1: Average annual GDP growth rates in Commonwealth LDCs, 2011-2019 (%)
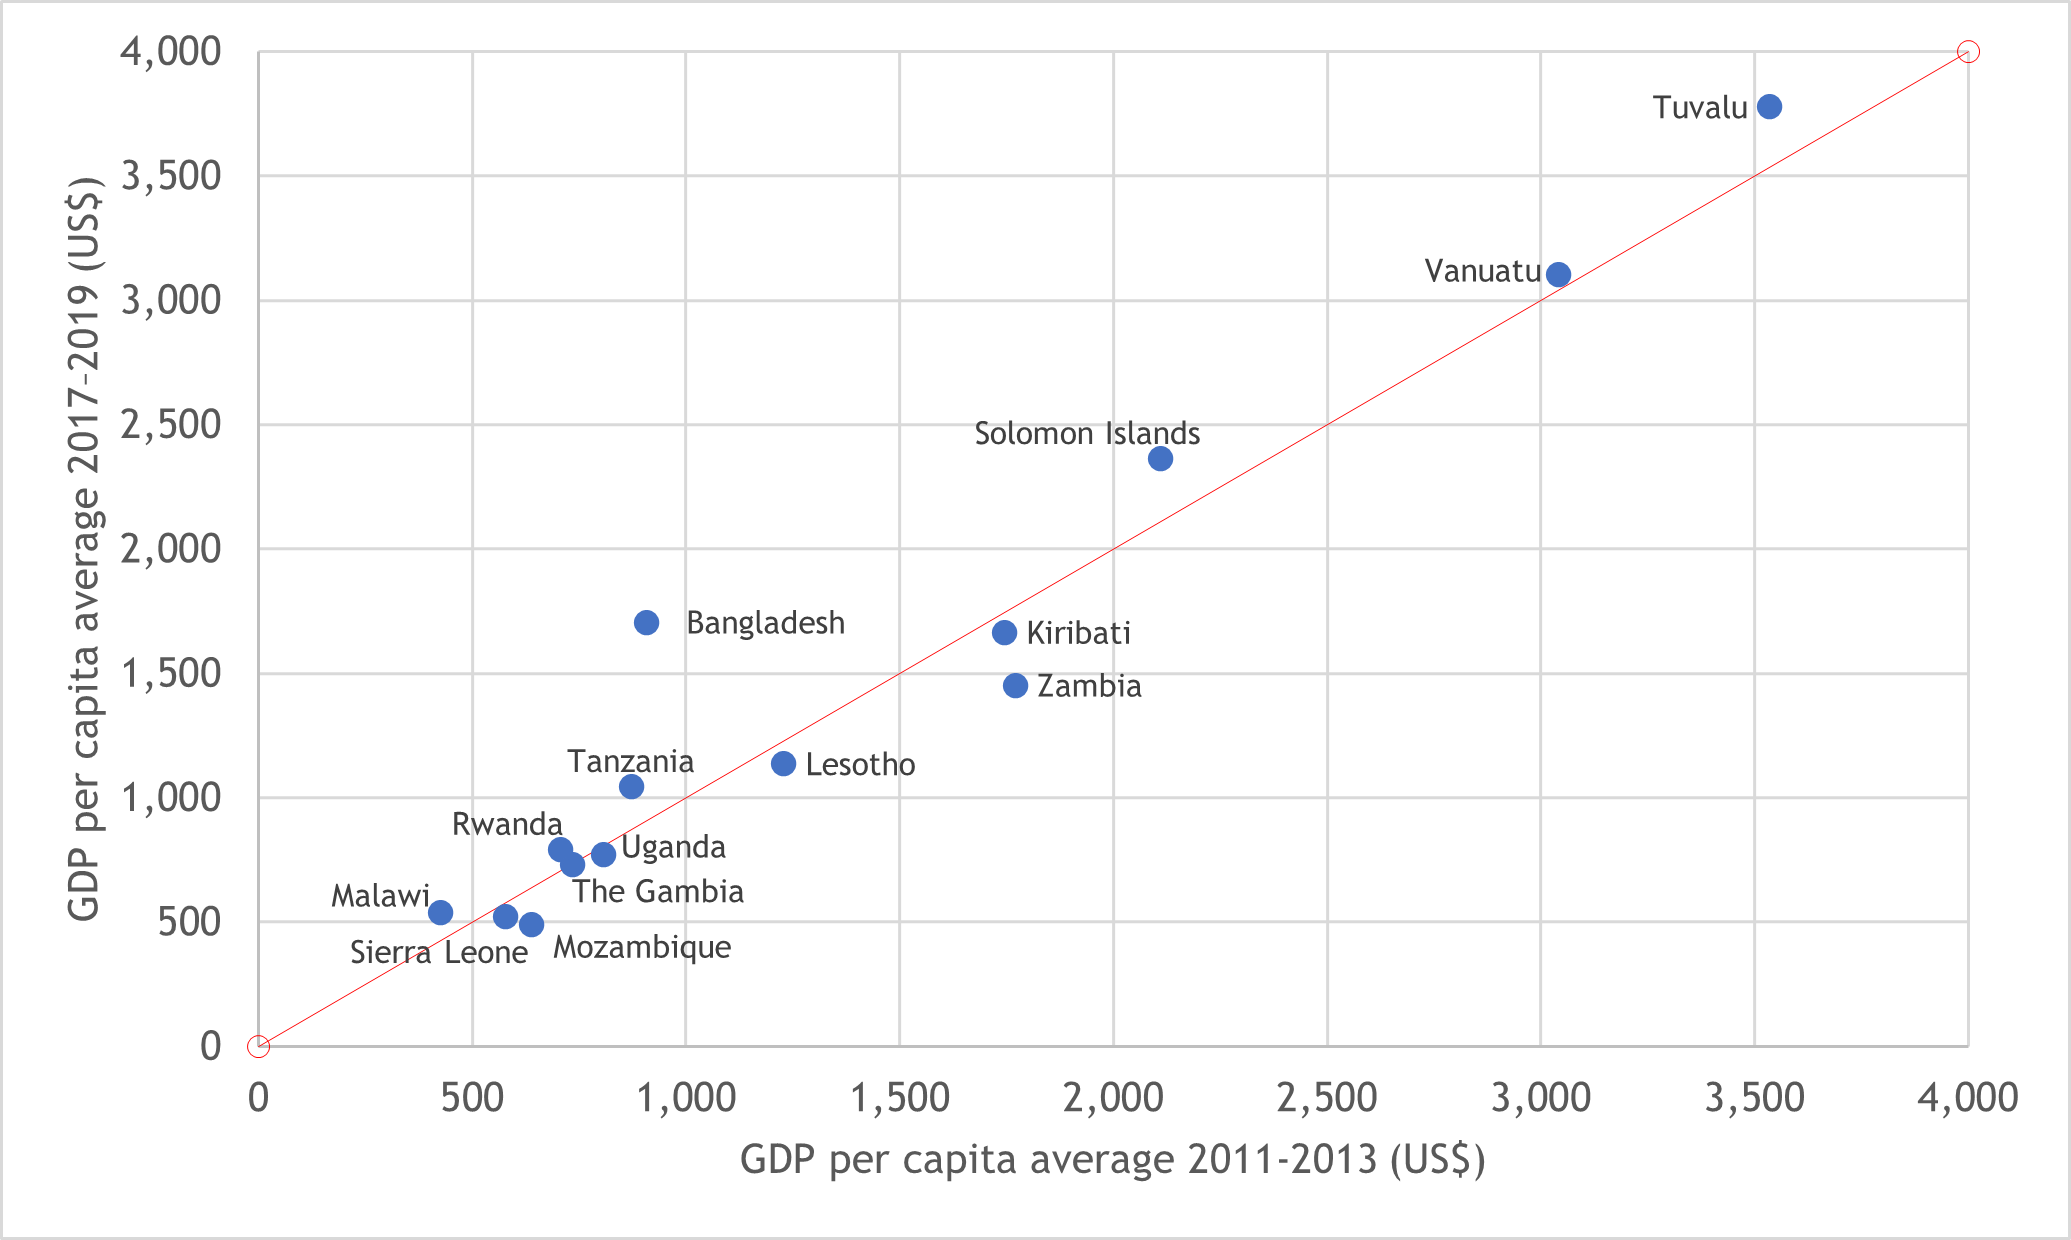
GDP per capita, a measure of economic output per person, varied significantly across Commonwealth LDCs between 2011 and 2019. The four Pacific LDCs – namely, Tuvalu (US$3,777), Vanuatu ($3,103), Solomon Islands ($2,363) and Kiribati ($1,665) – together with Bangladesh ($1,706) recorded the highest GDP per capita when measured in three-year averages from 2017 to 2019. Over this period, average GDP per capita levels in all five of these countries, along with Zambia, exceeded the graduation threshold of $1,222 set by the United Nations Committee for Development Policy (CDP) in the 2021 triennial review of the list of LDCs. In turn, averages for the equivalent three-year period fell below the graduation threshold in all other Commonwealth LDCs and were lowest in Mozambique ($489), Sierra Leone ($520) and Malawi ($539).
By comparing three-year averages for 2011-2013 and 2017-2019, Figure 2 shows that GDP per capita levels increased in half of the Commonwealth LDCs between the beginning and (pre-pandemic) end of the IPoA implementation period, but declined in The Gambia, Kiribati, Lesotho, Mozambique, Sierra Leone, Uganda and Zambia. This indicates that these countries have moved further adrift of the graduation threshold since the start of the IPoA.
It is also worth noting the significant chasm present between average levels of GDP per capita in Commonwealth LDCs compared with their non-Commonwealth counterparts. Among non-Commonwealth LDCs, the three-year average GDP per capita for 2017-2019 stood at US$9,919, compared with just $1,435 across the 14 Commonwealth LDCs. However, this gap had narrowed slightly compared with the respective three-year averages for 2011-2013.
Figure 2: GDP per capita in Commonwealth LDCs, 2011-2013 vs. 2017-2019 averages (current US$)
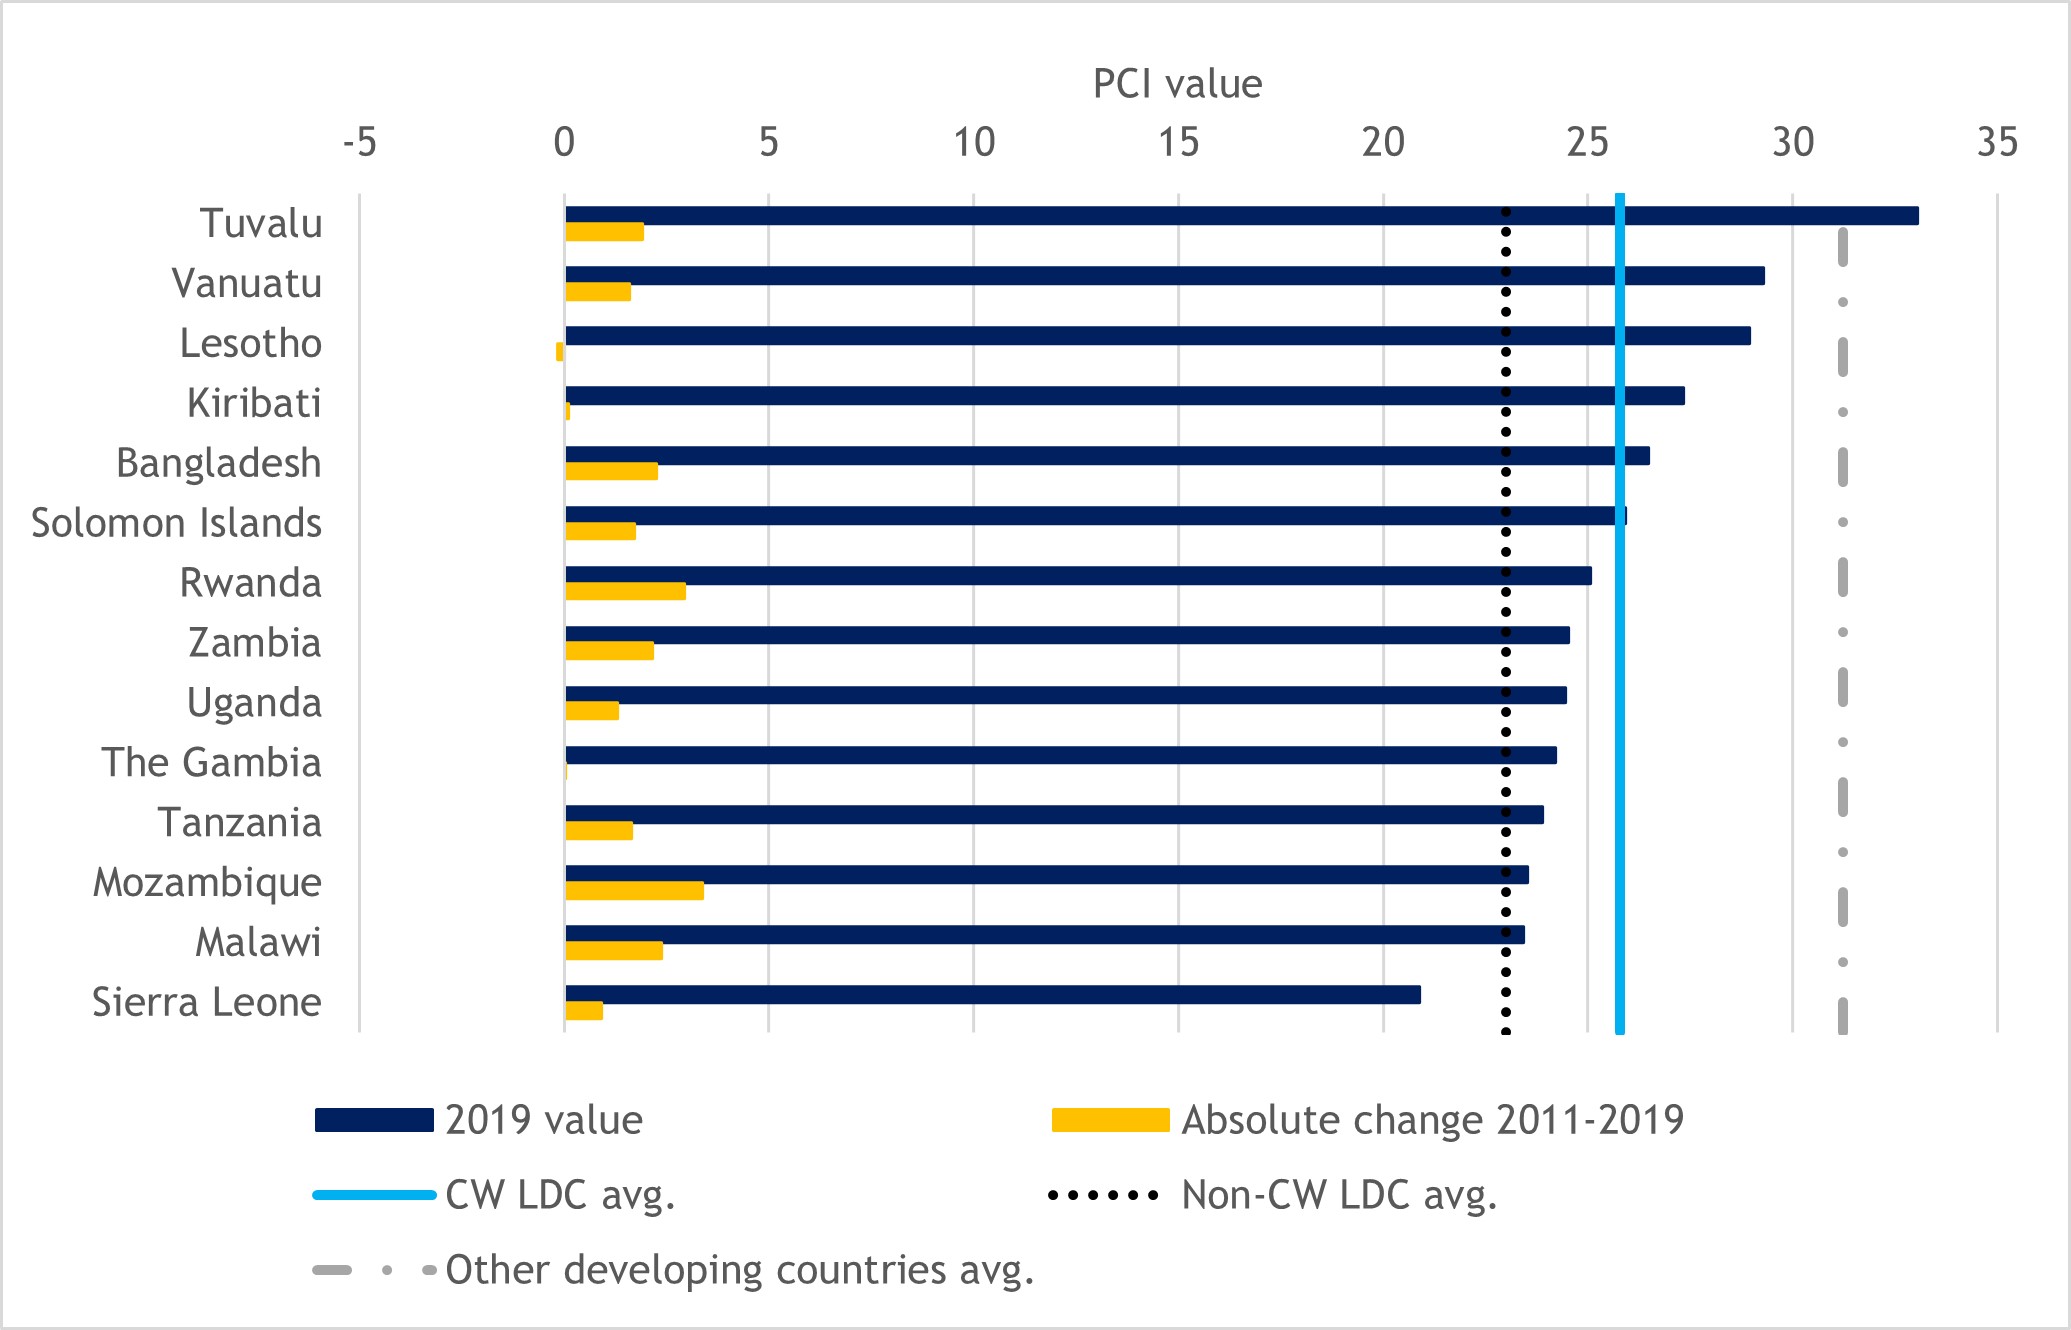
To help understand the status of productive capacity in Commonwealth LDCs, Figure 3 outlines 2019 values for all 14 Commonwealth LDCs on the Productive Capacities Index (PCI) published by the United Nations Conference on Trade and Development (UNCTAD), and examines how these values changed between 2011 and 2019. The PCI measures productive capacity on a scale of 1 to 100 by constructing a composite index based on multidimensional components reflecting different aspects of each economy’s human capital, natural capital, energy, transport, ICT, institutions and private sector, along with progress in terms of structural change. Commonwealth LDCs performed better, on average, on the PCI relative to non-Commonwealth LDCs in 2019 (with average values of 25.8 and 23, respectively). Sierra Leone was the only Commonwealth LDC to register a PCI value lower than the average for non-Commonwealth LDCs. Nevertheless, Commonwealth LDCs collectively fell some way short of the average PCI value for other developing countries (31.2).
This broad perspective masks significant variation in productive capacities across Commonwealth LDCs. Those in the Pacific region generally fared best, alongside Bangladesh and Lesotho, both of which have developed manufacturing capacity in the garments sector and, in the case of Bangladesh, also in other sectors such as pharmaceuticals. Lesotho aside, productive capacities as reflected in the PCI were lowest among the African LDCs in 2019. Even so, three African LDCs – Mozambique, Rwanda and Malawi – registered the largest absolute increases in PCI values between 2011 and 2019, pointing to notable improvements in productive capacity. Overall, among the 14 Commonwealth LDCs, only The Gambia and Lesotho failed to register increases in PCI values between the two years.
Despite the improvements in overall PCI values that most Commonwealth LDCs recorded, many still ranked among the lowest globally on the PCI towards the end of the IPoA implementation period. This implies that many Commonwealth LDCs are losing ground relative to other countries in the development of productive capacity. Tuvalu, the top-performing Commonwealth LDC, ranked 79th out of 193 countries in 2018 (the latest available year for rankings at the time of writing). Nine of the remaining 13 Commonwealth LDCs were ranked in the bottom quadrant, with Malawi and Sierra Leone faring the worst, in 171st and 186th position, respectively. These rankings, and the respective scores on the PCI, indicate there remains significant scope to improve productive capacity in Commonwealth LDCs.
Figure 3: Commonwealth LDCs’ performance on the PCI, 2019 value and absolute change in index value, 2011-2019
To better understand the factors underpinning productive capacity in LDCs and assess how they fared during the IPoA period, the analysis now turns to various dimensions of the environment and ecosystem supporting productive activity. It focuses initially on the performance of Commonwealth LDCs on selected indicators relevant to the four dimensions highlighted under productive capacity in the IPoA: infrastructure, energy, science, technology and innovation, and private sector development.
2.1.1 Physical infrastructure
The infrastructure pillar of the World Economic Forum (WEF) Global Competitiveness Index (GCI) provides a broad perspective on the relative utility and competitiveness of a country’s infrastructure. Table 2 compares the rankings of selected Commonwealth LDCs on the Infrastructure pillar in 2011 and 2019, revealing some heterogeneity in performance across the grouping. Relative improvements to overall infrastructure were recorded in just three (Bangladesh, Uganda and Tanzania) of the nine Commonwealth LDCs included in the GCI, with Bangladesh recording the most progress by climbing 20 positions in the rankings. The Gambia, Lesotho, Malawi, Rwanda and Zambia all saw the relative competitiveness of their infrastructure deteriorate across the IPoA implementation period. As of 2019, Rwanda was the top-ranked Commonwealth LDC on the infrastructure pillar.
Table 2: Rank of selected Commonwealth LDCs on the Infrastructure pillar of the GCI, 2011 and 2019
|
Country |
2011 |
2019 |
|
Bangladesh |
134 |
114 |
|
The Gambia |
80 |
117 |
|
Lesotho |
124 |
136 |
|
Malawi |
131 |
132 |
|
Mozambique |
123 |
133 |
|
Rwanda |
101 |
111 |
|
Tanzania |
130 |
121 |
|
Uganda |
128 |
115 |
|
Zambia |
112 |
124 |
Notes: No data for Kiribati, Sierra Leone, Solomon Islands, Tuvalu or Vanuatu. Data for 2011 reflects the respective country rankings on the 2011-2012 GCI. 2019 data drawn from the GCI 4.0.
Source: WEF GCI
2.1.2 Energy
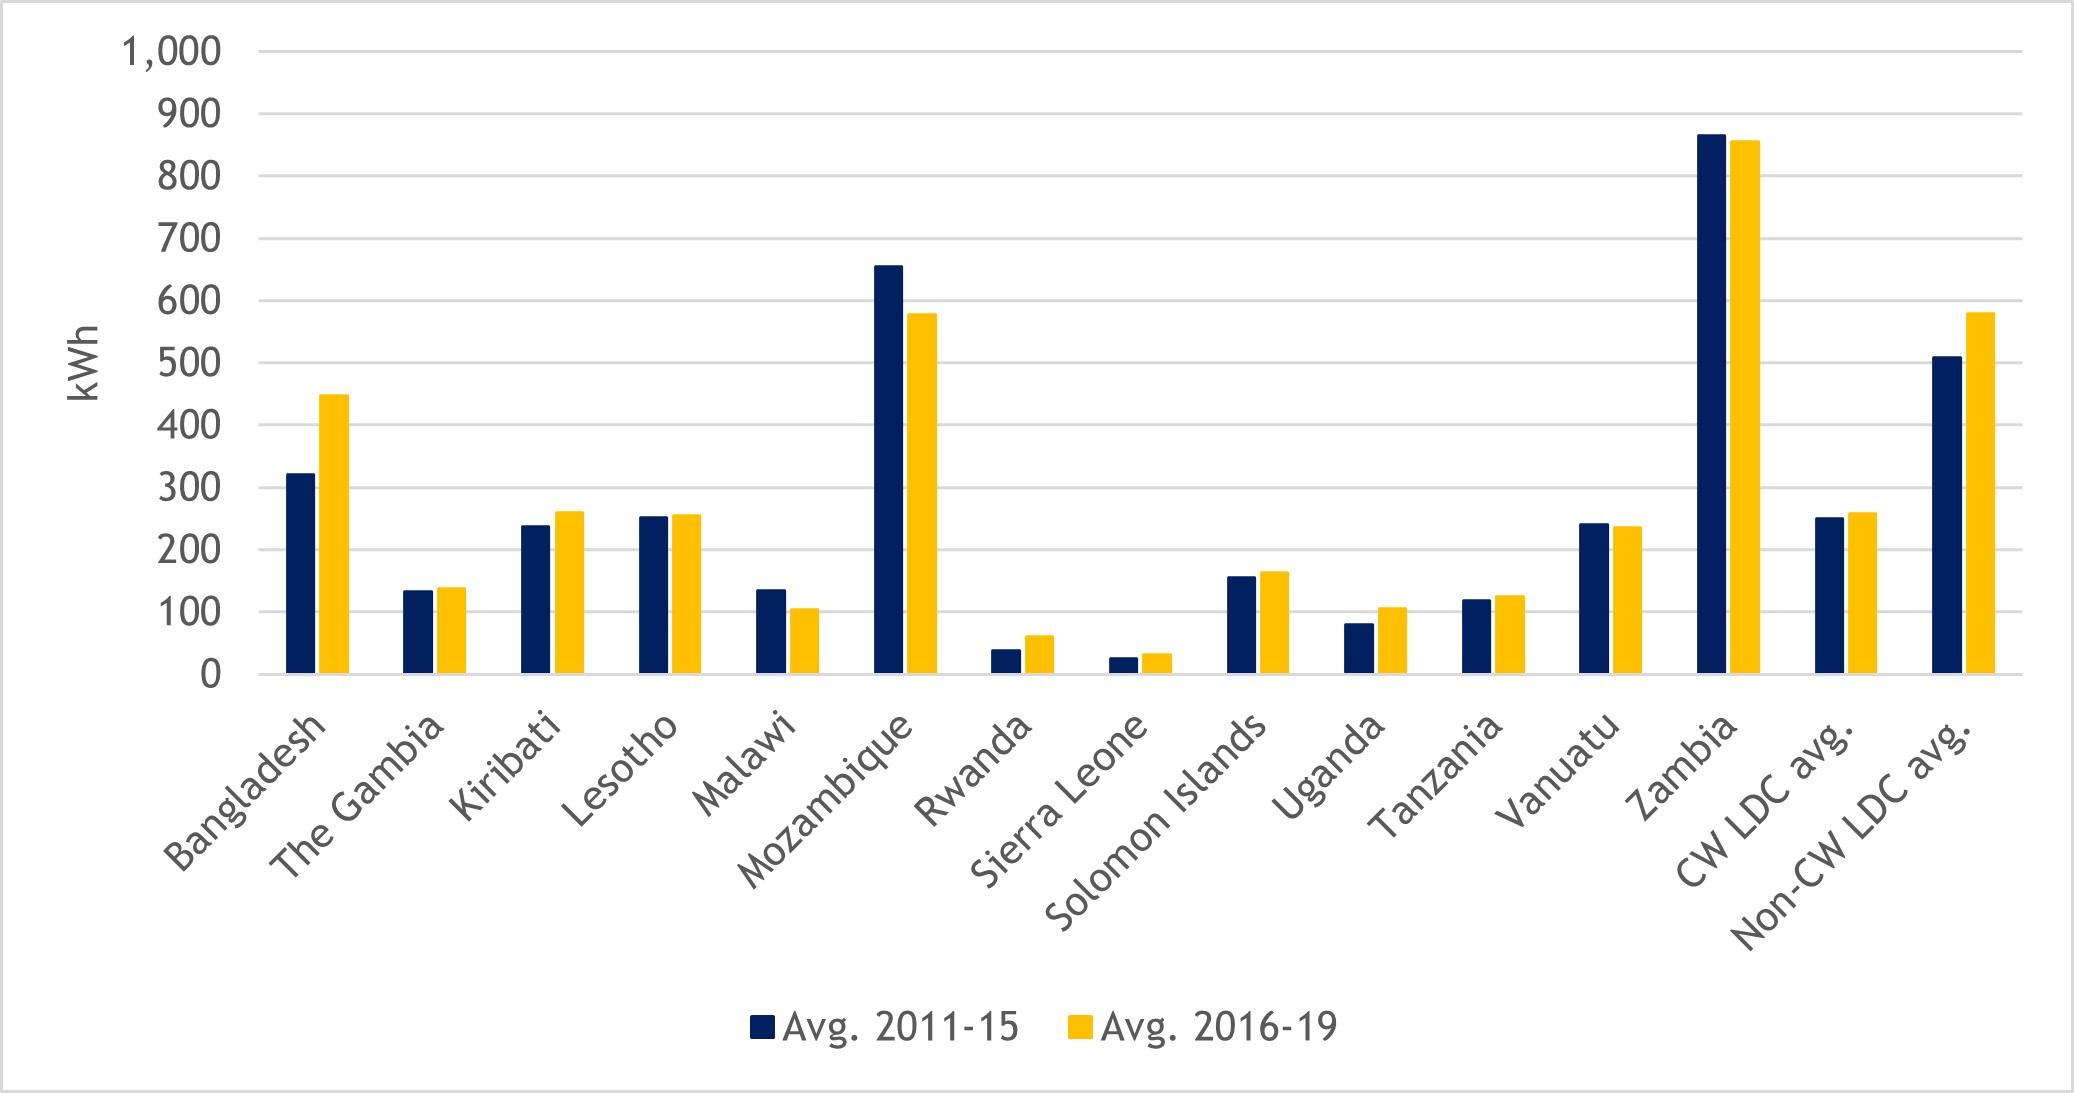
Energy represents a fundamental input into production in most sectors. As productive activity has expanded, and household demand has grown, so have levels of electricity consumption in Commonwealth LDCs. This is evident from Figure 4, which compares per capita electricity consumption in these countries in the first (2011-2015) and second (2016-2019) halves of the pre-pandemic IPoA implementation period. Zambia and Mozambique were the largest consumers of electricity on a per capita basis during both periods, although their relative consumption levels declined, on average, in the second half of the IPoA. Per capita consumption levels increased, on average, in all but two of the remaining Commonwealth LDCs (Malawi and Vanuatu were the only exceptions), placing increasing pressure on what were often already severely constrained national grids. This highlights the urgent need to build electricity supply capacity and diversify energy sources in Commonwealth LDCs, which only intensified during the IPoA period.
Figure 4: Electricity consumption per capita in Commonwealth LDCs, 2011-2019 (kWh)
SDG 7 targets access to affordable, reliable and modern energy for all by 2030. The IPoA pursued a similar objective, prioritising universal access to energy. Encouragingly, all 14 Commonwealth LDCs expanded access to electricity among their populations between 2011 and 2019. However, as Figure 5 shows, the goal of achieving universal access to electricity remained a considerable way off for many Commonwealth LDCs at the end of the IPoA. Kiribati and Tuvalu are notable exceptions, possibly due to their relatively small populations. On the back of strong growth since 2011, both countries achieved close to universal access by 2019, with 98.6 and 99.9 per cent of their populations enjoying access to electricity, respectively. Bangladesh is also well on the way to achieving universal access, with 88 per cent of the population able to access electricity in 2019, up from just 55 per cent in 2011. In contrast, less than 30 per cent of the population in Malawi, Sierra Leone and Mozambique had access to electricity in 2019, and fewer than 40 per cent in Lesotho, Rwanda, Uganda and Tanzania.
Boosting electricity generation and supply will be critical for enhancing access to electricity in these countries, both for production and for household consumption. Investment in alternative and renewable energy sources can play an instrumental role in this regard, while also helping facilitate a shift towards a more sustainable future. The IPoA aimed to significantly increase the share of electricity generation through renewable energy sources by 2020. Table 3 reveals that some Commonwealth LDCs made noteworthy progress towards this goal by raising renewable energy electricity generation capacity over the course of the IPoA implementation period. Uganda and Rwanda, for example, both managed to expand capacity in this area by more than 150 per cent between 2011 and 2019. Sierra Leone (up by 83 per cent) and Bangladesh (79 per cent increase) also recorded relatively large increases in capacity over the period. Renewable energy generation capacity expanded in all 14 Commonwealth LDCs but remained limited in some, particularly the Pacific LDCs and The Gambia, all of which have notably smaller populations. As of 2019, Zambia, Mozambique and Uganda boasted the highest levels of renewable energy generation capacity.
Figure 5: Share of population in Commonwealth LDCs with access to electricity, 2011 and 2019 (%)
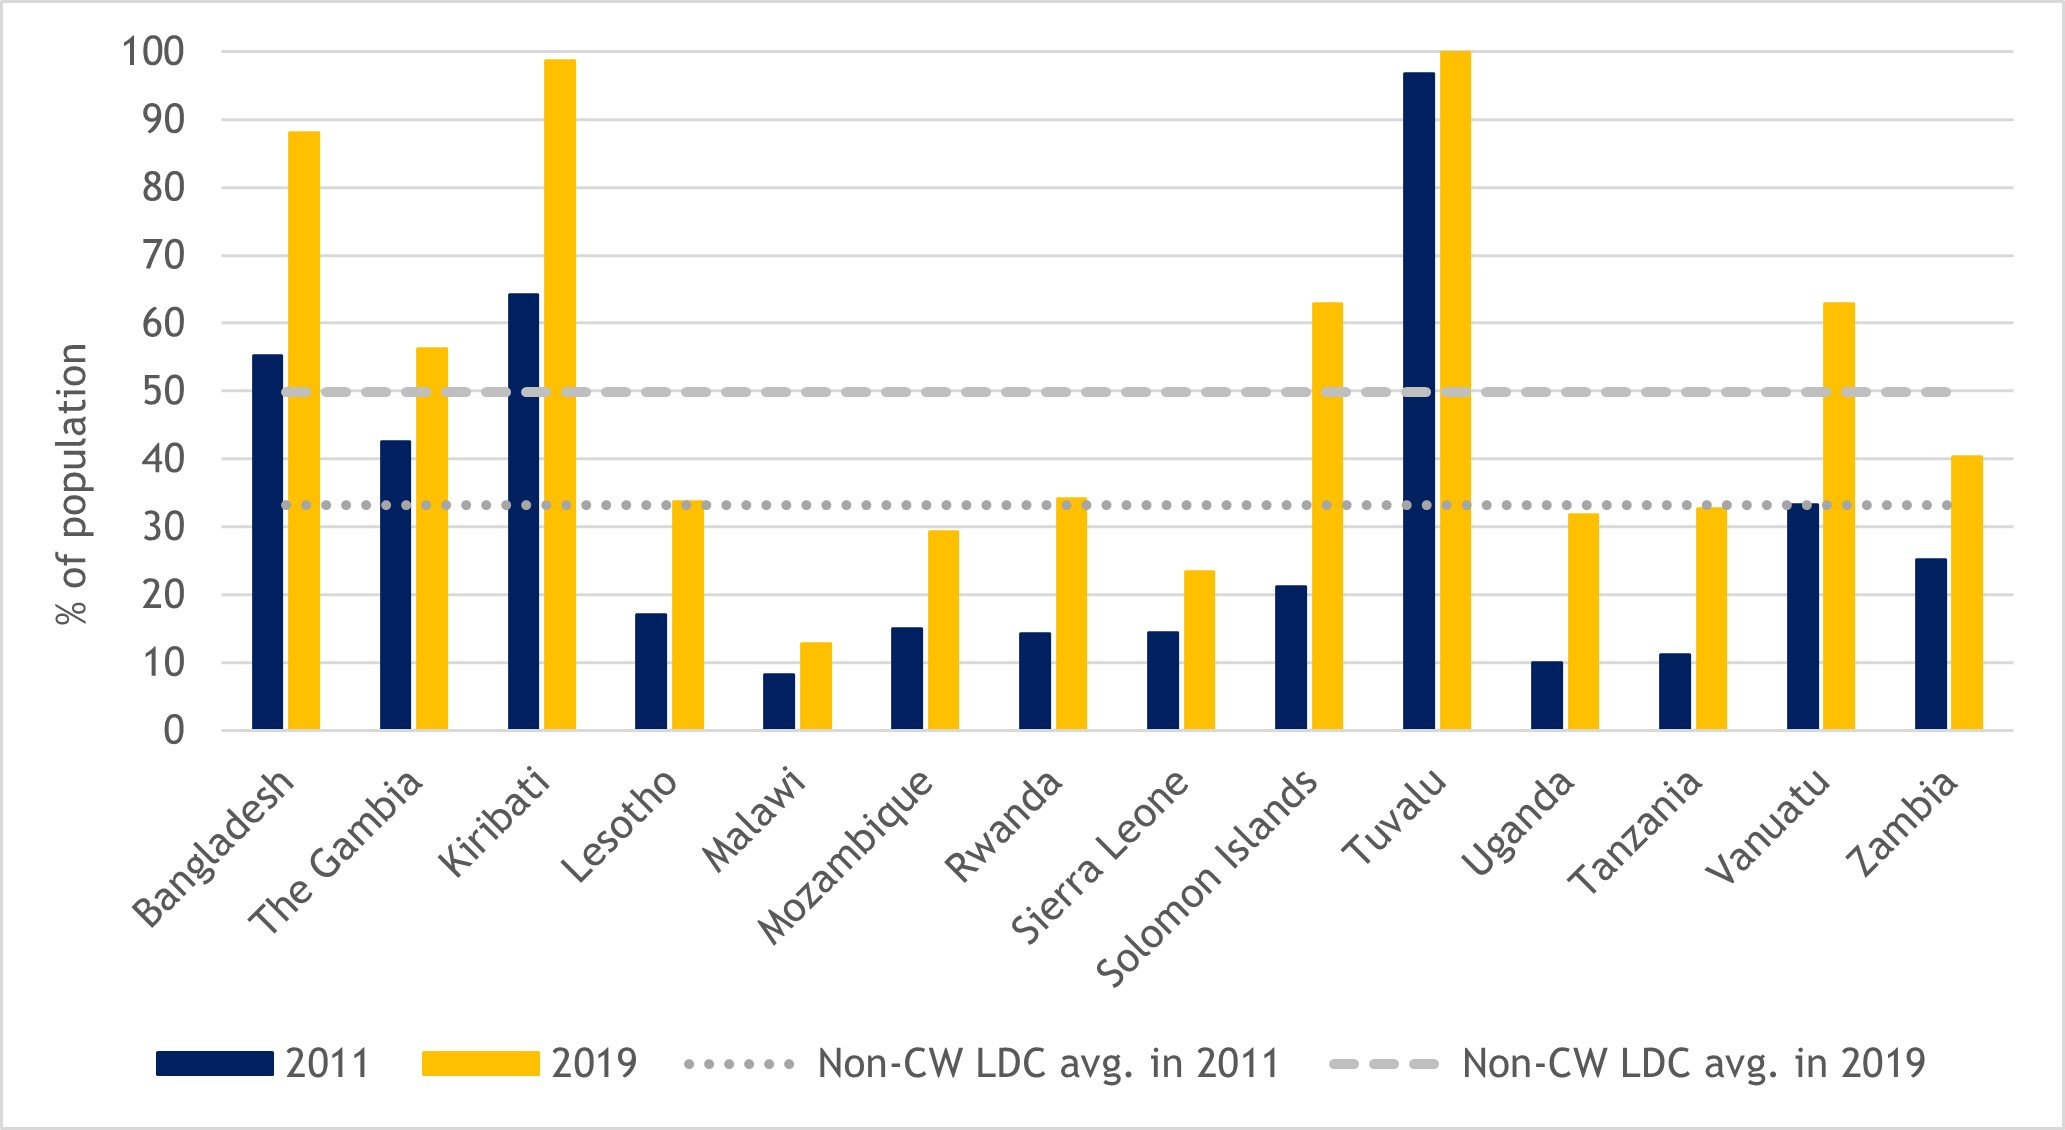
Table 3: Renewable energy electricity capacity (MW) in Commonwealth LDCs, 2011-2019
|
Country |
2011 |
2012 |
2013 |
2014 |
2014 |
2016 |
2017 |
2018 |
2019 |
|
Bangladesh |
267 |
291 |
329 |
356 |
382 |
399 |
423 |
439 |
477 |
|
The Gambia |
2 |
3 |
3 |
3 |
3 |
3 |
3 |
3 |
3 |
|
Kiribati |
0 |
0 |
1 |
1 |
2 |
3 |
3 |
3 |
3 |
|
Lesotho |
73 |
75 |
75 |
75 |
75 |
75 |
75 |
75 |
75 |
|
Malawi |
301 |
302 |
305 |
371 |
375 |
376 |
383 |
402 |
409 |
|
Mozambique |
2,198 |
2,201 |
2,205 |
2,207 |
2,211 |
2,214 |
2,233 |
2,273 |
2,313 |
|
Rwanda |
56 |
58 |
62 |
77 |
109 |
118 |
127 |
131 |
141 |
|
Sierra Leone |
54 |
54 |
55 |
90 |
90 |
91 |
99 |
99 |
99 |
|
Solomon Islands |
1 |
1 |
1 |
2 |
2 |
3 |
4 |
4 |
4 |
|
Tanzania |
632 |
638 |
641 |
652 |
659 |
670 |
675 |
679 |
686 |
|
Tuvalu |
0 |
0 |
0 |
0 |
2 |
2 |
2 |
2 |
2 |
|
Uganda |
465 |
616 |
746 |
766 |
782 |
784 |
827 |
907 |
1177 |
|
Vanuatu |
7 |
7 |
7 |
8 |
8 |
9 |
10 |
11 |
12 |
|
Zambia |
1,935 |
1,942 |
2,302 |
2,302 |
2,311 |
2,431 |
2,441 |
2,442 |
2,538 |
|
CW LDC avg. |
428 |
442 |
481 |
494 |
501 |
513 |
522 |
534 |
567 |
|
Non-CW LDC avg. |
476 |
503 |
534 |
559 |
628 |
673 |
773 |
838 |
906 |
|
Developing countries avg. (excl. LDCs) |
6,345 |
6,900 |
7,712 |
8,597 |
9,567 |
10,654 |
11,881 |
13,123 |
14,237 |
Source: International Renewable Energy Agency
2.1.3 Science, technology, innovation and digitalisation
Innovation, coupled with the development and deployment of new technologies, can serve as important drivers of productivity growth, diversification and, ultimately, structural transformation. Unfortunately, technological progress and innovation remains limited in many Commonwealth LDCs. The combined share of worldwide trademark applications – a measure of innovative activity in an economy – among all 14 Commonwealth LDCs stagnated over the IPoA period at just 0.6 per cent. These mostly originated in Bangladesh, which contributed 0.3 per cent of the trademark applications made globally in 2019. Similarly, outside of Bangladesh, patent applications originating in Commonwealth LDCs were generally limited (Table 4). Only Mozambique and Zambia consistently registered patent applications on an annual basis across the pre-pandemic IPoA period, averaging 45 and 30 applications, respectively, each year between 2011 and 2019. Bangladesh was the only Commonwealth LDC to exceed the average number of patent applications made by non-Commonwealth LDCs in each year from 2011 to 2019.
Table 4: Patent applications made in selected Commonwealth LDCs, annual totals, 2011-2019
|
Country |
2011 |
2012 |
2013 |
2014 |
2015 |
2016 |
2017 |
2018 |
2019 |
Annual avg. 2011-2019 |
|
Bangladesh |
306 |
354 |
303 |
293 |
340 |
344 |
302 |
368 |
413 |
336 |
|
The Gambia |
2 |
2 |
4 |
16 |
6 |
|||||
|
Lesotho |
4 |
1 |
3 |
|||||||
|
Malawi |
3 |
4 |
4 |
5 |
6 |
4 |
4 |
|||
|
Mozambique |
23 |
40 |
43 |
60 |
54 |
40 |
50 |
47 |
47 |
45 |
|
Rwanda |
70 |
12 |
6 |
6 |
6 |
7 |
18 |
|||
|
Tanzania |
2 |
|
3 |
4 |
2 |
|
|
25 |
|
7 |
|
Tuvalu |
7 |
10 |
9 |
|||||||
|
Uganda |
14 |
8 |
9 |
16 |
6 |
11 |
||||
|
Zambia |
24 |
38 |
39 |
39 |
32 |
33 |
22 |
24 |
23 |
30 |
|
CW LDC avg. |
72 |
101 |
68 |
60 |
56 |
64 |
77 |
61 |
85 |
71 |
|
Non-CW LDC avg. |
58 |
49 |
57 |
30 |
73 |
90 |
104 |
140 |
117 |
80 |
|
Developing country avg. (excl. LDCs) |
16,070 |
16,996 |
18,938 |
20,720 |
22,242 |
24,529 |
25,484 |
28,246 |
28,540 |
22,418 |
Source: World Intellectual Property Organization
Note: Country selection based on data availability.
New digital technologies are increasingly driving innovation, especially amid the rapid acceleration of digitalisation and the growth of the digital economy globally. Effectively harnessing digital technologies is thus becoming critical to the long-term development of LDCs, both to drive structural transformation and to ensure they can exploit the opportunities presented by frontier technologies linked to Industry 4.0. This has become even more urgent with the accelerated reliance on digital technologies that the emergence of the COVID-19 pandemic has precipitated.
A major goal articulated in the IPoA was for LDCs to develop modern and inclusive ICT infrastructure, including affordable mobile broadband and internet connectivity, and to promote the digitalisation of services (UN-OHRLLS, 2021). An associated aim was to build and expand digital connectivity and the application of digital technologies in areas such as banking, education, health and governance (Schroderus-Fox, 2017).
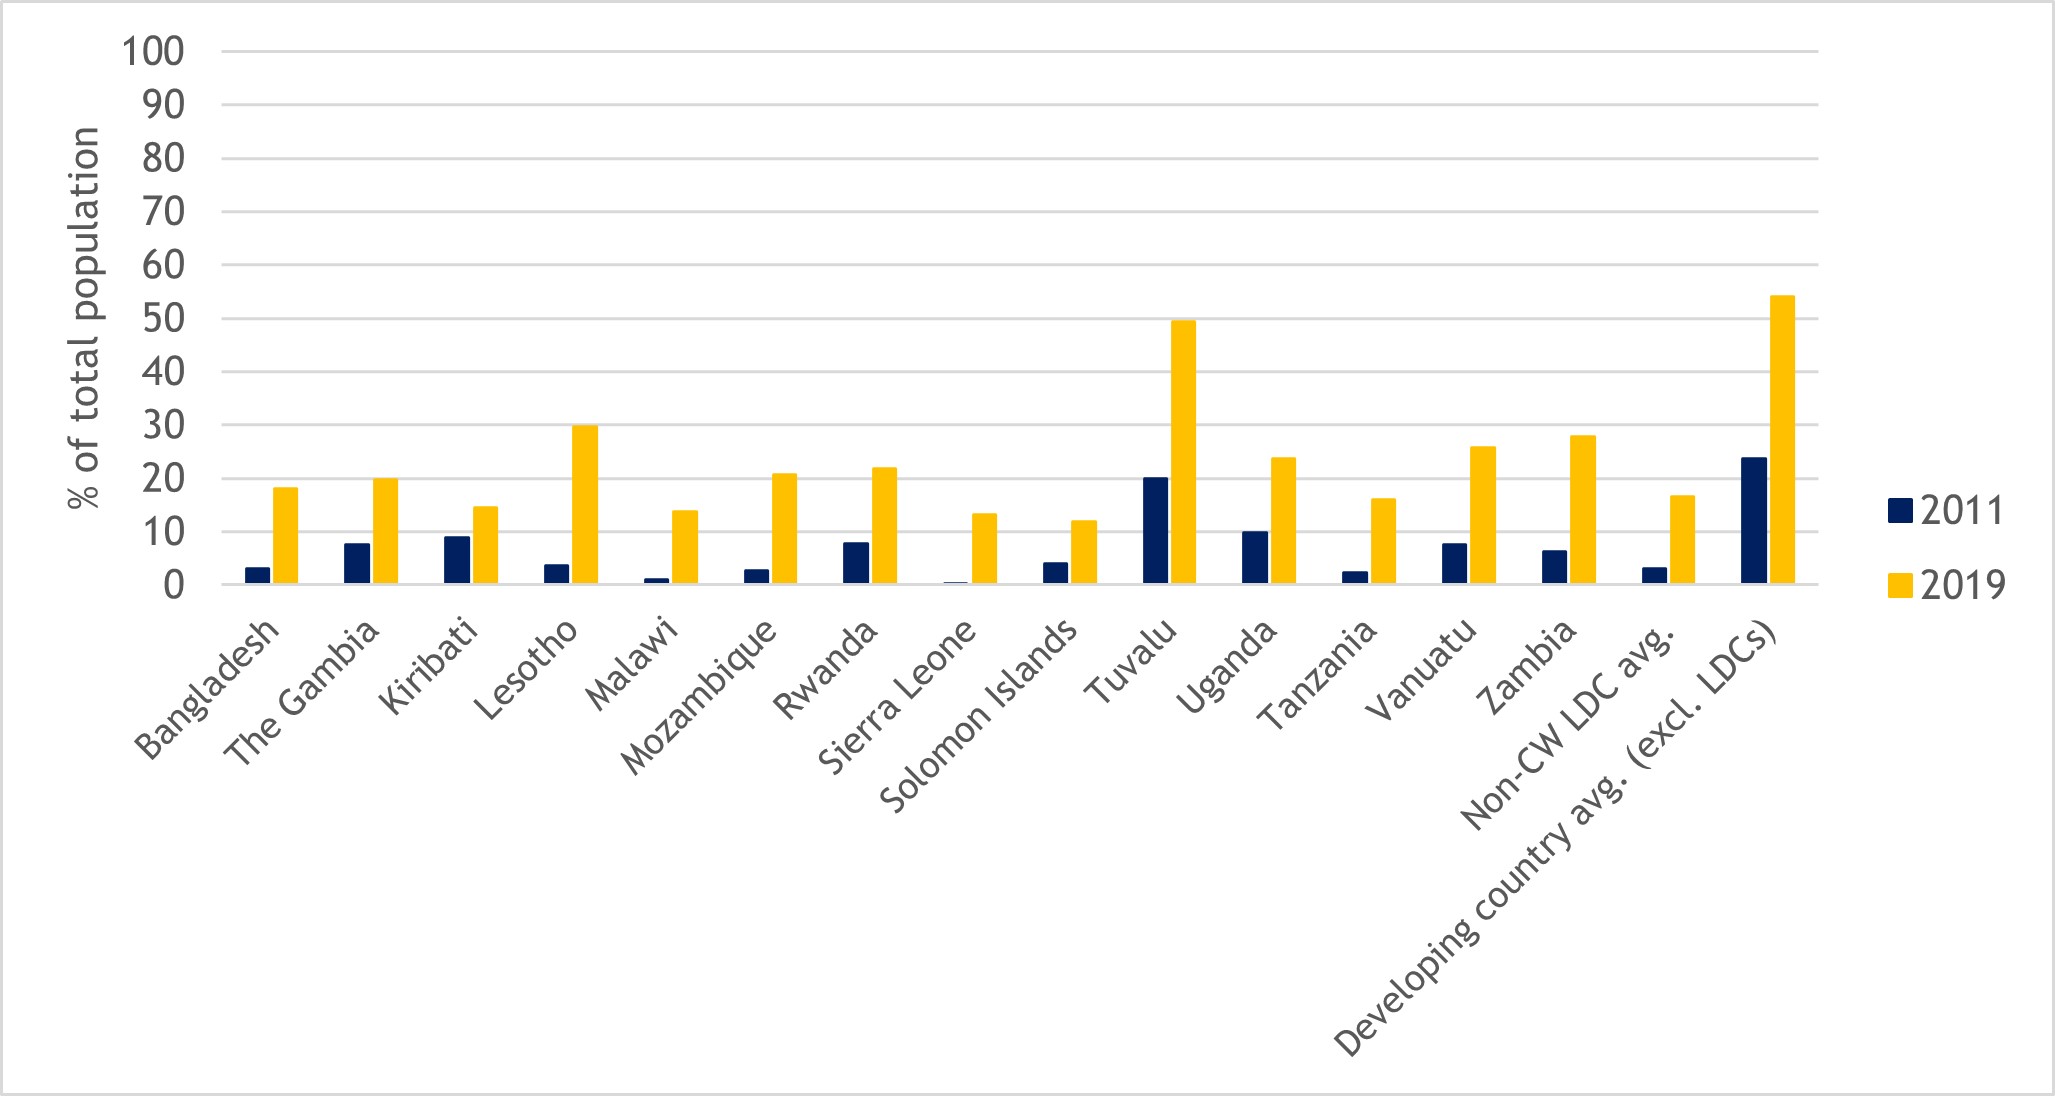
Worryingly, significant digital divides persist within LDCs and between LDCs and other developing countries, and Commonwealth LDCs made only limited progress in addressing these divides during the course of the IPoA. For instance, while the IPoA sought to attain universal internet access in LDCs by 2020, access to the internet remained well short of this target in all 14 Commonwealth LDCs as of 2019 (Figure 6). This was despite all Commonwealth LDCs recording substantial improvements in the share of their populations using the internet between 2011 and 2019. These shares grew by 29 percentage points in Tuvalu, 26 percentage points in Lesotho and nearly 22 percentage points in Zambia compared with 2011 levels. Double-digit growth in these shares was recorded in all but two (Solomon Islands and Kiribati) of the remaining Commonwealth LDCs. Even so, in Tuvalu, which boasts the highest level of internet access among the Commonwealth LDCs, half of the population still did not have access to the internet in 2019. In seven of the remaining Commonwealth LDCs, less than 20 per cent of the population was able to access the internet in 2019.
Figure 6: Proportion of individuals using the internet in Commonwealth LDCs, 2011 and 2019 (% of total population)
Source: World Bank World Development Indicators
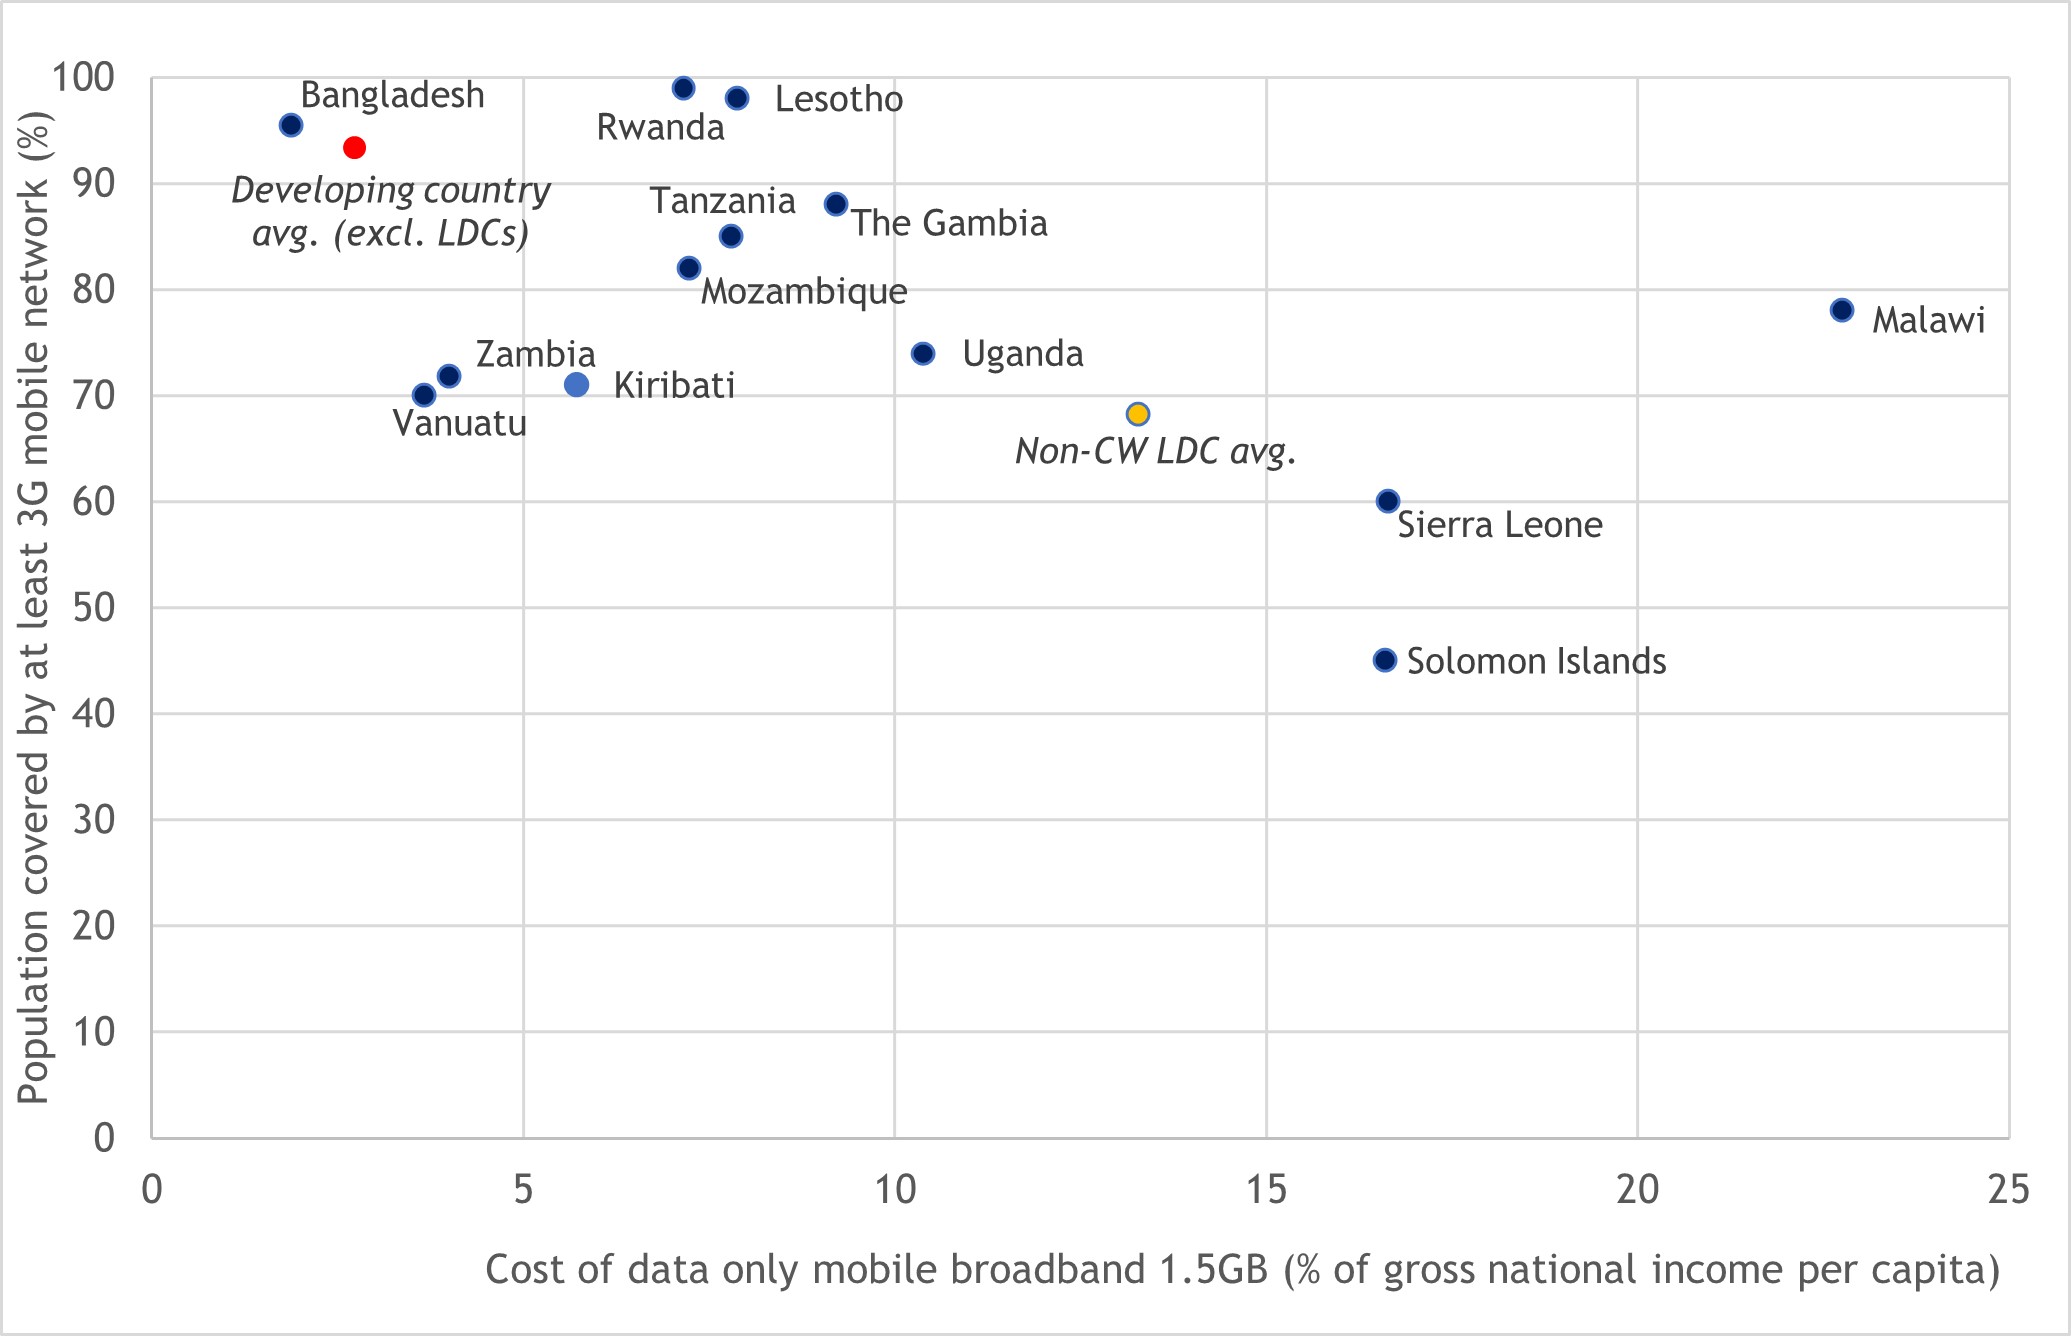
Poor network connectivity, linked to inadequate digital infrastructure and high costs of mobile data, is among the principal reasons for the low levels of internet access in some Commonwealth LDCs. For example, as Figure 7 reveals, Solomon Islands and Sierra Leone are plagued by both relatively low population shares with access to at least a 3G mobile network and high costs of mobile broadband data. Similarly, while 3G network coverage in Malawi is higher, the cost of 1.5 GB of mobile broadband data is considerably greater than in other Commonwealth LDCs as well as compared with the average across all non-Commonwealth LDCs. Only Bangladesh has managed to combine near-universal 3G mobile network coverage with relatively low costs for mobile broadband data, outstripping even the developing country average on both measures.
Figure 7: Network coverage and affordability of mobile data in Commonwealth LDCs, 2019 (%)
Source: ITU data
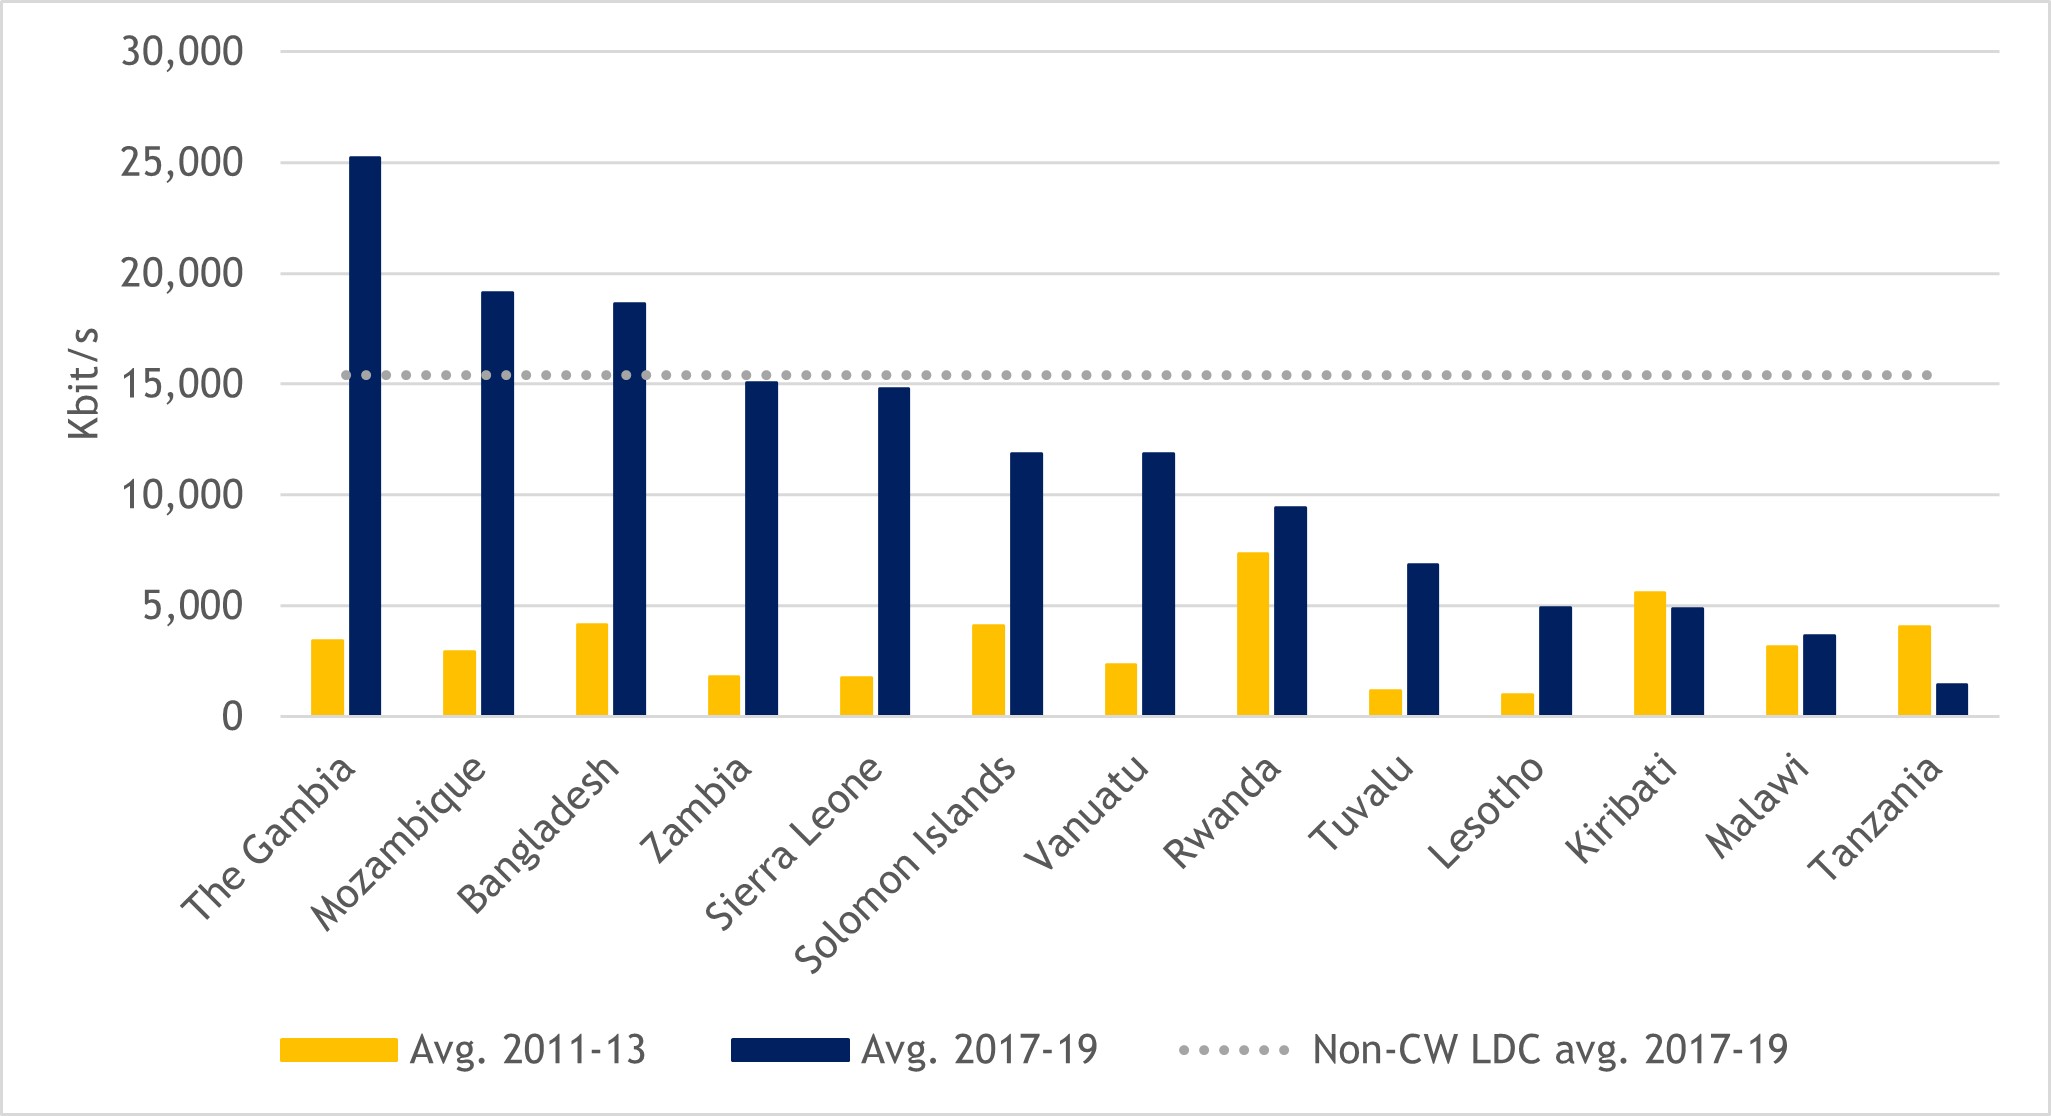
More encouragingly, some Commonwealth LDCs recorded major improvements in internet bandwidth during the IPoA implementation period, pointing to much-needed progress in upgrading the quality and efficiency of internet infrastructure. When measured in kilobytes per second, the average international internet bandwidth per internet user over the three-year period from 2017 to 2019 was more than eight times higher in Sierra Leone and Zambia and more than seven times higher in The Gambia compared with the equivalent average for the first three years of the IPoA implementation period (2011-2013). Except for Kiribati and Tanzania, all other Commonwealth LDCs registered increases in international internet bandwidth per internet user between these two periods (Figure 8).
Figure 8: International internet bandwidth per internet user, averages 2011-2013 vs. 2017-2019 (Kbit/s)
Source: Commonwealth Secretariat (calculated using ITU data)
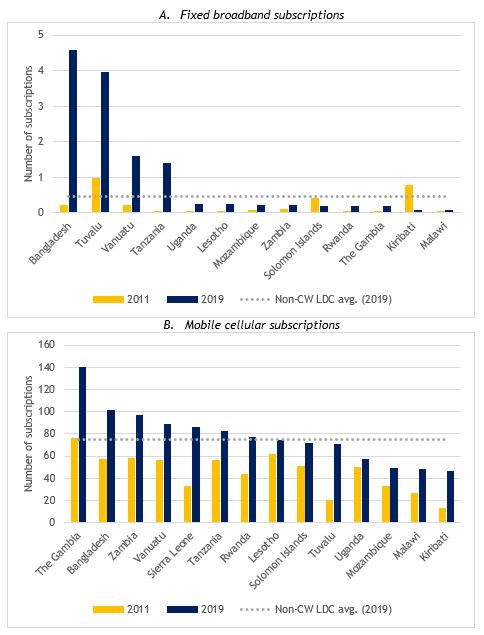
Uptake of fixed broadband and mobile cellular subscriptions also increased markedly during the IPoA implementation period in most Commonwealth LDCs. The number of fixed broadband subscriptions per 100 people was highest in 2019 in Bangladesh, Tuvalu, Vanuatu and Tanzania, and increased between 2011 and 2019 in all but two of the 14 Commonwealth LDCs (Kiribati and Solomon Islands being the only exceptions) (panel A in Figure 9). Even so, there were fewer than five broadband subscriptions per 100 people in Bangladesh in 2019 and fewer than four in Tuvalu, and in nine Commonwealth LDCs this number was less than one. In comparison, mobile cellular subscriptions were far more widespread, exceeding 46 subscriptions per 100 people in all 14 Commonwealth LDCs, and reaching up to 140 in The Gambia in 2019. The numbers of subscriptions per 100 people also increased in all Commonwealth LDCs between 2011 and 2019 (panel B in Figure 9).
Figure 9: Fixed broadband and mobile cellular subscriptions per 100 people, 2011 and 2019
Source: World Bank World Development Indicators
2.1.4 Private sector development
A strong private sector has a key role to play in stimulating economic growth and development, including through its role as a source of investment and by generating productivity gains, creating jobs, strengthening skills and developing technological capabilities. Unfortunately, the economies of many LDCs have historically been characterised by an underdeveloped private sector (UNESCAP, 2021).
Typically, private sector development strategies have focused on improving various aspects of the business environment in which firms and entrepreneurs operate. This potentially spans many areas, ranging from enhancements in market access and competitiveness to business-friendly licensing, standards and regulations.
As general markers of the conditions in which the private sector operates in Commonwealth LDCs, Table 5 documents these countries’ overall rankings on the WEF GCI. This assesses the microeconomic and macroeconomic foundations of national competitiveness under 12 pillars: institutions, infrastructure (discussed earlier), ICT adoption, macroeconomic stability, health, skills, product markets, the labour market, financial systems, market size, business dynamism and innovation capability. Most Commonwealth LDCs are in the bottom 20 of the 141 countries included in the GCI in 2019, and only Bangladesh, Lesotho, Tanzania and Uganda managed to improve their standing relative to the 2011 rankings (columns 2–4 in Table 5).
Table 5: Commonwealth LDC rankings on the GCI, 2011 and 2019
|
Rank /142 |
Rank /141 |
|
|
|
Country |
2011 |
2019 |
Change 2011-2019 |
|
Bangladesh |
108 |
105 |
+3 |
|
The Gambia |
99 |
124 |
-25 |
|
Kiribati |
|
|
|
|
Lesotho |
135 |
131 |
+4 |
|
Malawi |
117 |
128 |
-11 |
|
Mozambique |
133 |
137 |
-4 |
|
Rwanda |
70 |
100 |
-30 |
|
Sierra Leone |
|
|
|
|
Solomon Islands |
|
|
|
|
Tanzania |
120 |
117 |
+3 |
|
Uganda |
121 |
115 |
+6 |
|
Vanuatu |
|
|
|
|
Zambia |
113 |
120 |
-7 |
Notes: Countries included based on data availability. The WEF introduced a new GCI 4.0 to integrate the notion of the Fourth Industrial Revolution into its definition of competitiveness. The 2019 GCI data is based on the updated GCI 4.0.
Source: WEF GCI
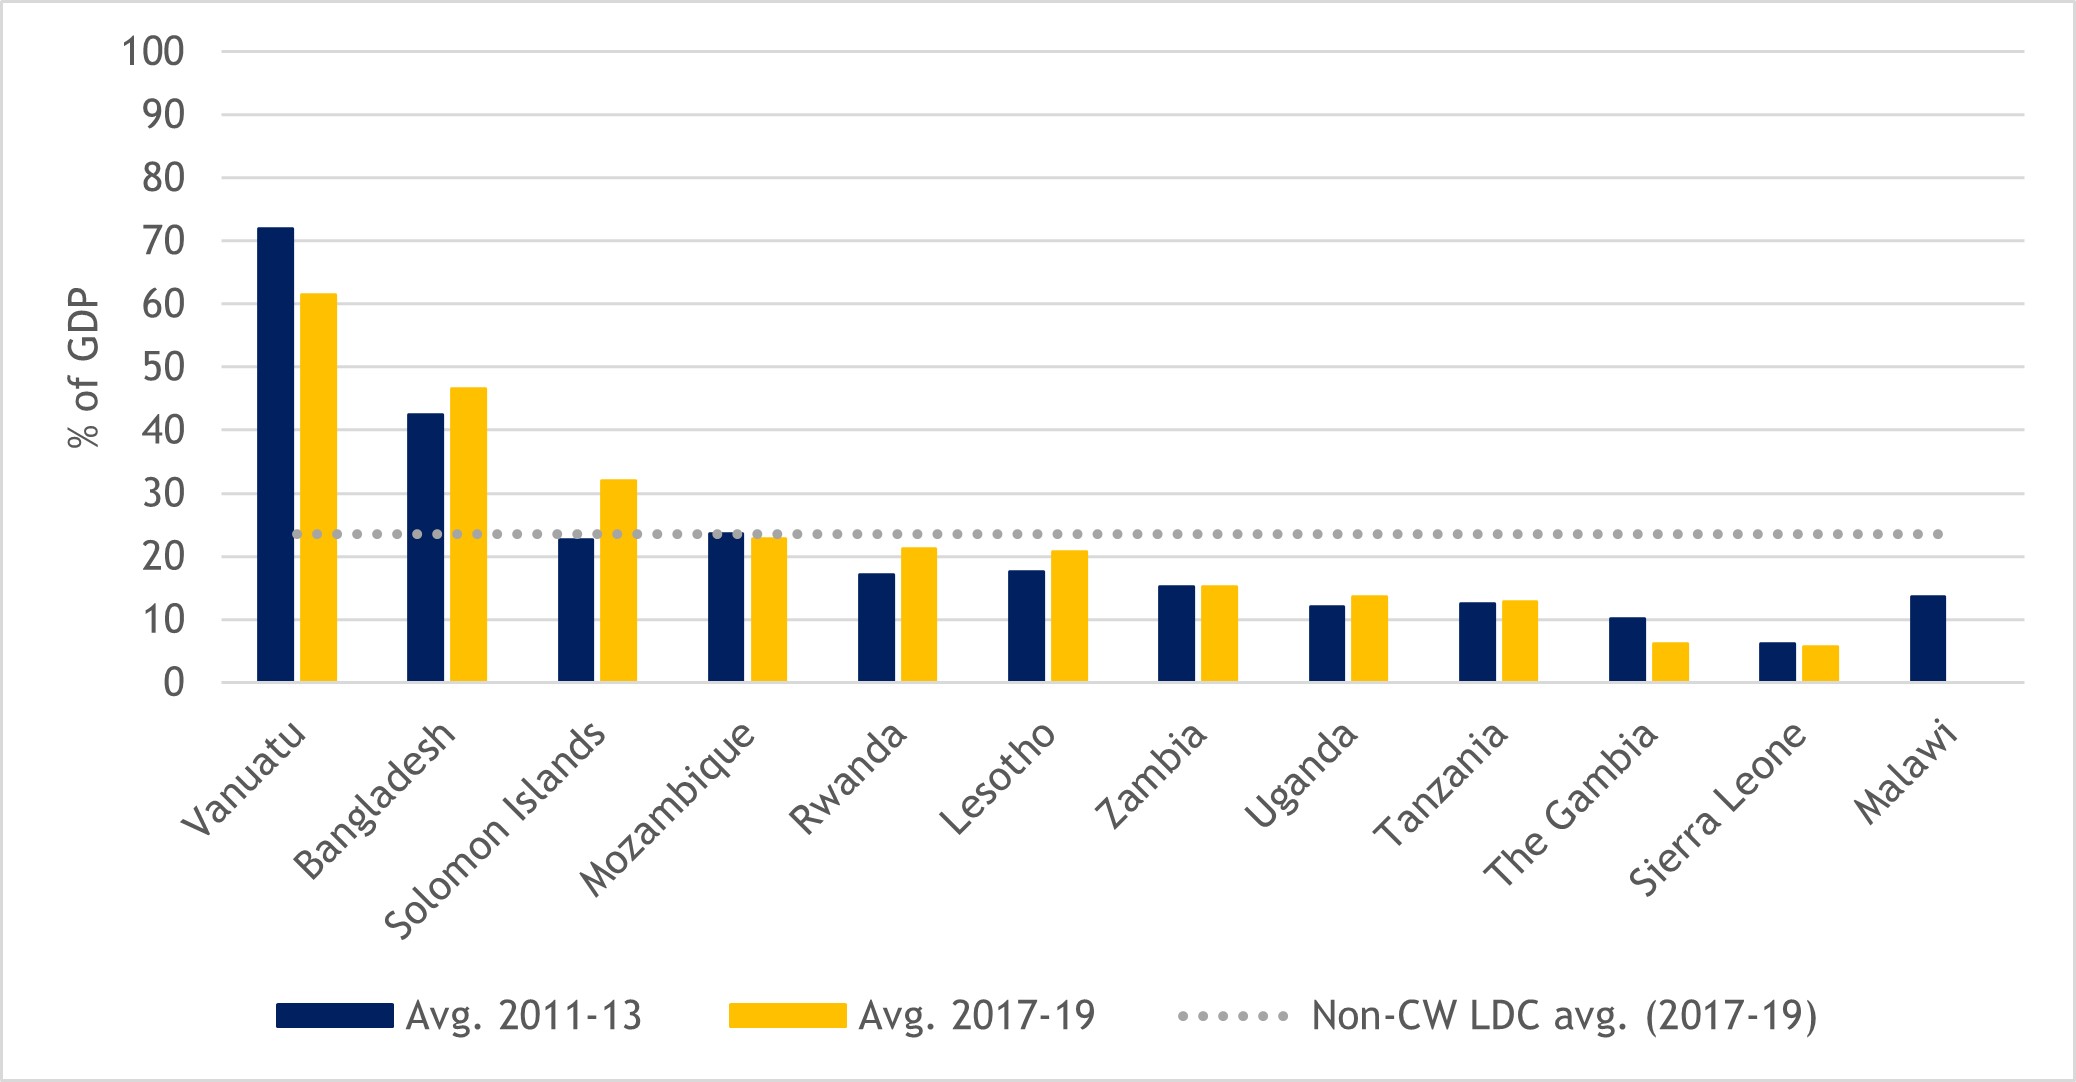
An alternative way to measure the health and functioning of the domestic private sector, as well as the broader development of the financial sector, is to consider the level of domestic financial resources provided to the private sector by financial corporations, for instance through loans, purchases of non-equity securities or trade credits. Such credit can be a key driver of economic activity by enabling domestic firms to finance investments (Dembiermont et al., 2013). Figure 10 presents a mixed picture of the provision of domestic credit to the private sector in Commonwealth LDCs. In Vanuatu, this percentage exceeded 60 per cent, on average, between 2017 and 2019, but was 10 percentage points lower compared with the beginning of the IPoA implementation period (2011-2013). In contrast, in Bangladesh, domestic credit to the private sector increased towards the end of the IPoA, reaching more than 46 per cent of GDP, on average, from 2017 to 2019. In most other Commonwealth LDCs, these credit levels remained low in comparison but did increase during the course of the IPoA.
Notably, in all but three Commonwealth LDCs (Bangladesh, Solomon Islands and Vanuatu), the average GDP shares of domestic credit to the private sector for 2017-2019 were lower than the equivalent average across all non-Commonwealth LDCs. This suggests there remains considerable scope to raise levels of domestic credit provided to the private sector in Commonwealth LDCs, including to finance investments in productive capacity.
Figure 10: Domestic credit to the private sector in Commonwealth LDCs, 2011-2013 and 2017-2019 averages (% of GDP)
Source: Commonwealth Secretariat (calculated using World Bank data)
In most countries around the world, the private sector is the primary source of job creation. Indeed, estimates suggest the private sector provides around 90 per cent of all jobs in developing countries (IFC, 2013). Hence, supporting private sector development in LDCs, including through access to finance, effective competition policy and a facilitative regulatory environment for business, is crucial to ensuring sustained employment creation and poverty reduction. Encouragingly from an employment perspective, unemployment rates remained fairly low and stable in most Commonwealth LDCs throughout the pre-pandemic years of IPoA implementation (Table 6). In Lesotho, however, the unemployment rate was markedly higher than for its peers at the start of the IPoA and declined only marginally across the decade, standing at 23.9 per cent in 2019. Zambia and The Gambia also experienced high rates of unemployment relative to other Commonwealth LDCs throughout the IPoA. In contrast, unemployment levels were lowest in Solomon Islands, Rwanda and Vanuatu.
Table 6: Unemployment rates in Commonwealth LDCs, 2011-2019 (% of total labour force)
|
Country |
2011 |
2012 |
2013 |
2014 |
2015 |
2016 |
2017 |
2018 |
2019 |
|
Bangladesh |
3.7 |
4.1 |
4.4 |
4.4 |
4.4 |
4.4 |
4.4 |
4.3 |
4.2 |
|
The Gambia |
9.4 |
9.4 |
9.4 |
9.4 |
9.3 |
9.2 |
9.1 |
9.0 |
8.9 |
|
Lesotho |
26.0 |
25.3 |
24.6 |
24.5 |
24.4 |
24.3 |
24.1 |
24.0 |
23.9 |
|
Malawi |
5.9 |
5.9 |
6.0 |
5.9 |
5.9 |
5.8 |
5.7 |
5.6 |
5.6 |
|
Mozambique |
3.3 |
3.4 |
3.4 |
3.4 |
3.4 |
3.4 |
3.3 |
3.2 |
3.2 |
|
Rwanda |
1.1 |
1.1 |
1.2 |
1.2 |
1.1 |
1.1 |
1.1 |
1.0 |
1.0 |
|
Sierra Leone |
4.3 |
4.4 |
4.6 |
4.7 |
4.6 |
4.6 |
4.5 |
4.4 |
4.4 |
|
Solomon Islands |
1.3 |
1.0 |
0.7 |
0.7 |
0.7 |
0.7 |
0.6 |
0.6 |
0.6 |
|
Tanzania |
3.5 |
3.2 |
2.9 |
2.1 |
2.1 |
2.1 |
2.0 |
2.0 |
2.0 |
|
Uganda |
3.6 |
3.6 |
1.9 |
1.9 |
1.9 |
1.8 |
1.8 |
1.8 |
1.7 |
|
Vanuatu |
1.9 |
1.9 |
1.9 |
1.8 |
1.8 |
1.8 |
1.8 |
1.7 |
1.7 |
|
Zambia |
10.3 |
7.9 |
8.6 |
9.3 |
10.1 |
10.9 |
11.6 |
12.0 |
11.9 |
|
CW LDC avg. |
6.2 |
5.9 |
5.8 |
5.8 |
5.8 |
5.8 |
5.8 |
5.8 |
5.8 |
|
Non-CW LDC avg. |
6.2 |
6.1 |
6.2 |
6.1 |
6.1 |
6.1 |
6.1 |
6.0 |
5.9 |
|
Developing countries avg. (excl. LDCs) |
7.8 |
7.7 |
7.7 |
7.7 |
7.7 |
7.8 |
7.7 |
7.7 |
7.6 |
Notes: Data are International Labour Organization (ILO) modelled estimates. No data available for Kiribati or Tuvalu.
Source: World Bank World Development Indicators
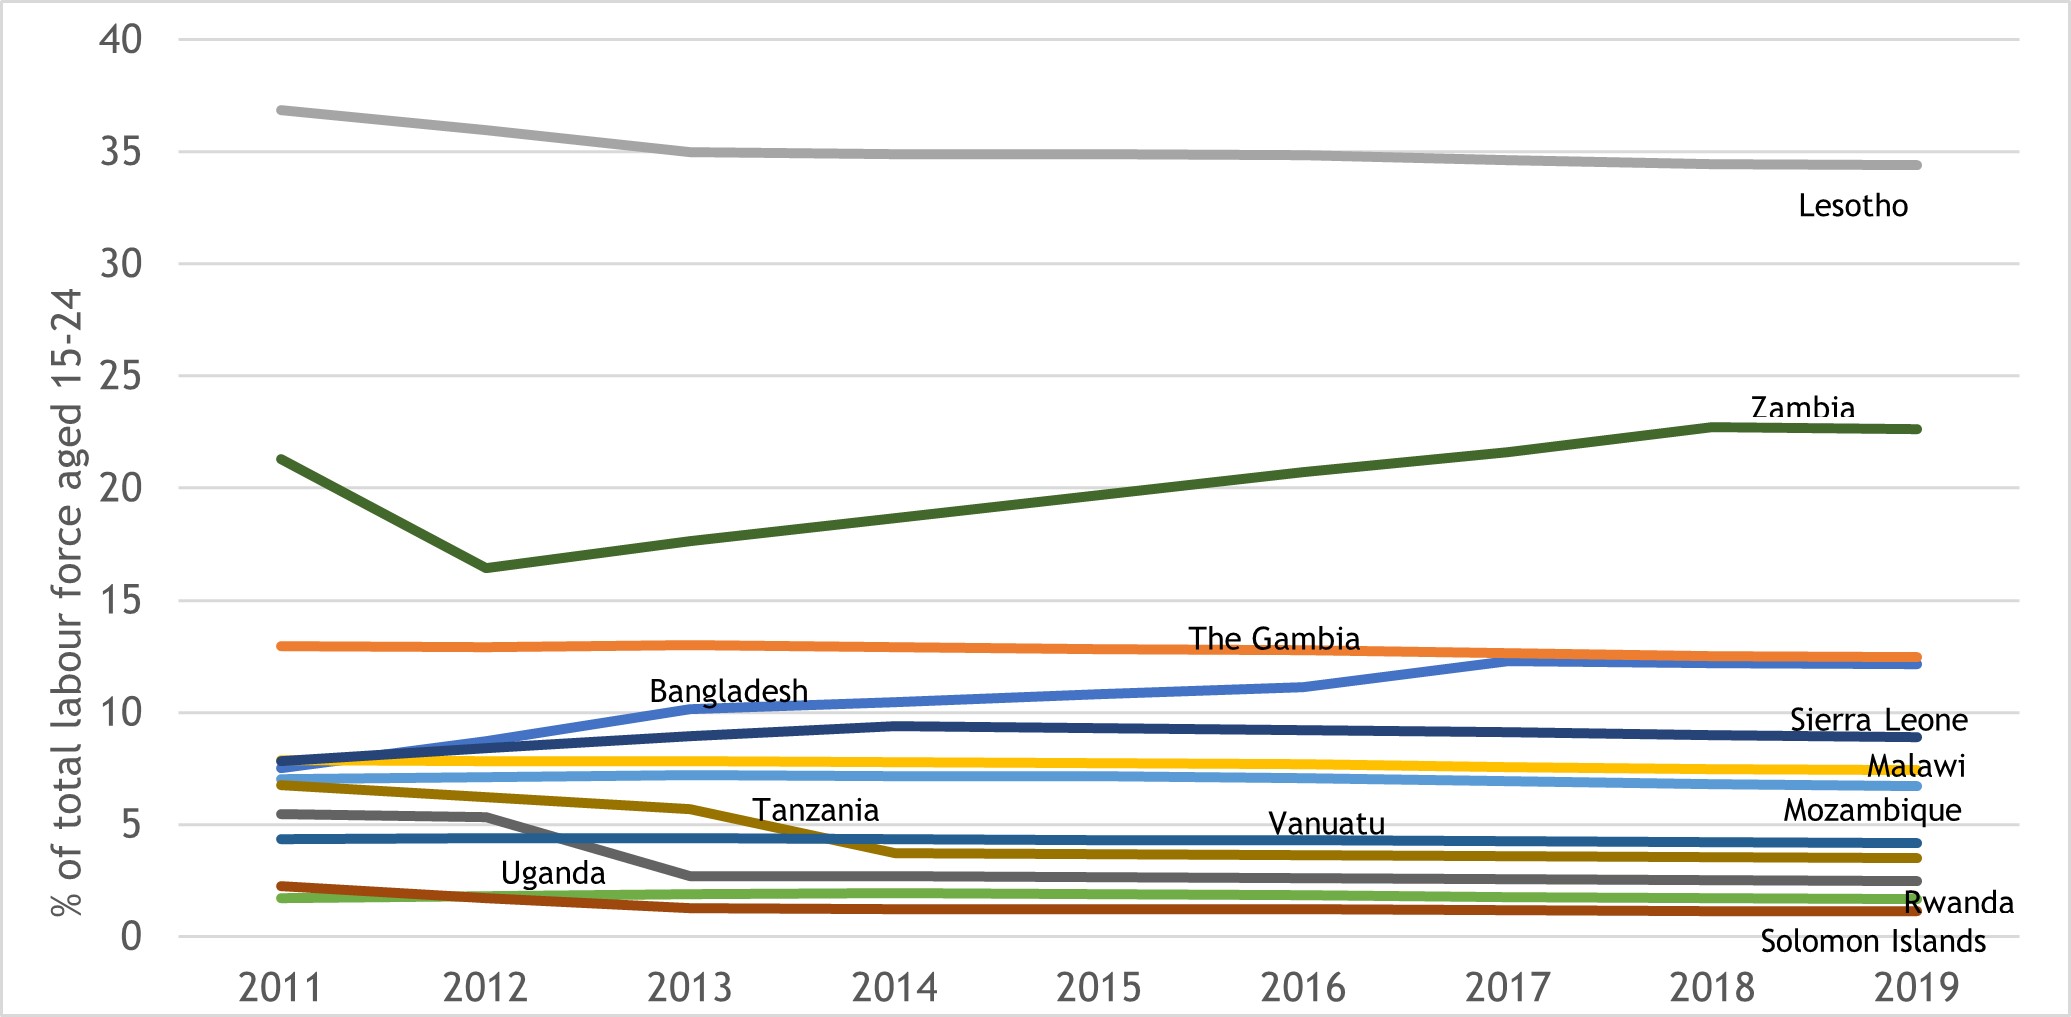
Despite generally manageable unemployment rates in most Commonwealth LDCs, high levels of youth unemployment and informal employment proved significant challenges for a number of these countries throughout the pre-pandemic period of IPoA implementation. Lesotho and Zambia suffered from especially high levels of unemployment among youth. In the case of Lesotho, while the youth unemployment rate declined marginally, it still stood at 34 per cent of the total labour force aged 15-24 in 2019 (Figure 11). In Zambia, the youth unemployment rate increased to 22.6 per cent in 2019. Similarly, rates of unemployment among youths increased in both Bangladesh and Sierra Leone between 2011 and 2019. More encouraging progress was made in the remaining eight Commonwealth LDCs, which all recorded equal or lower youth unemployment rates in 2019 compared with the 2011 levels.
Figure 11: Youth unemployment rates in Commonwealth LDCs, 2011-2019 (% of total labour force)
Source: World Bank World Development Indicators
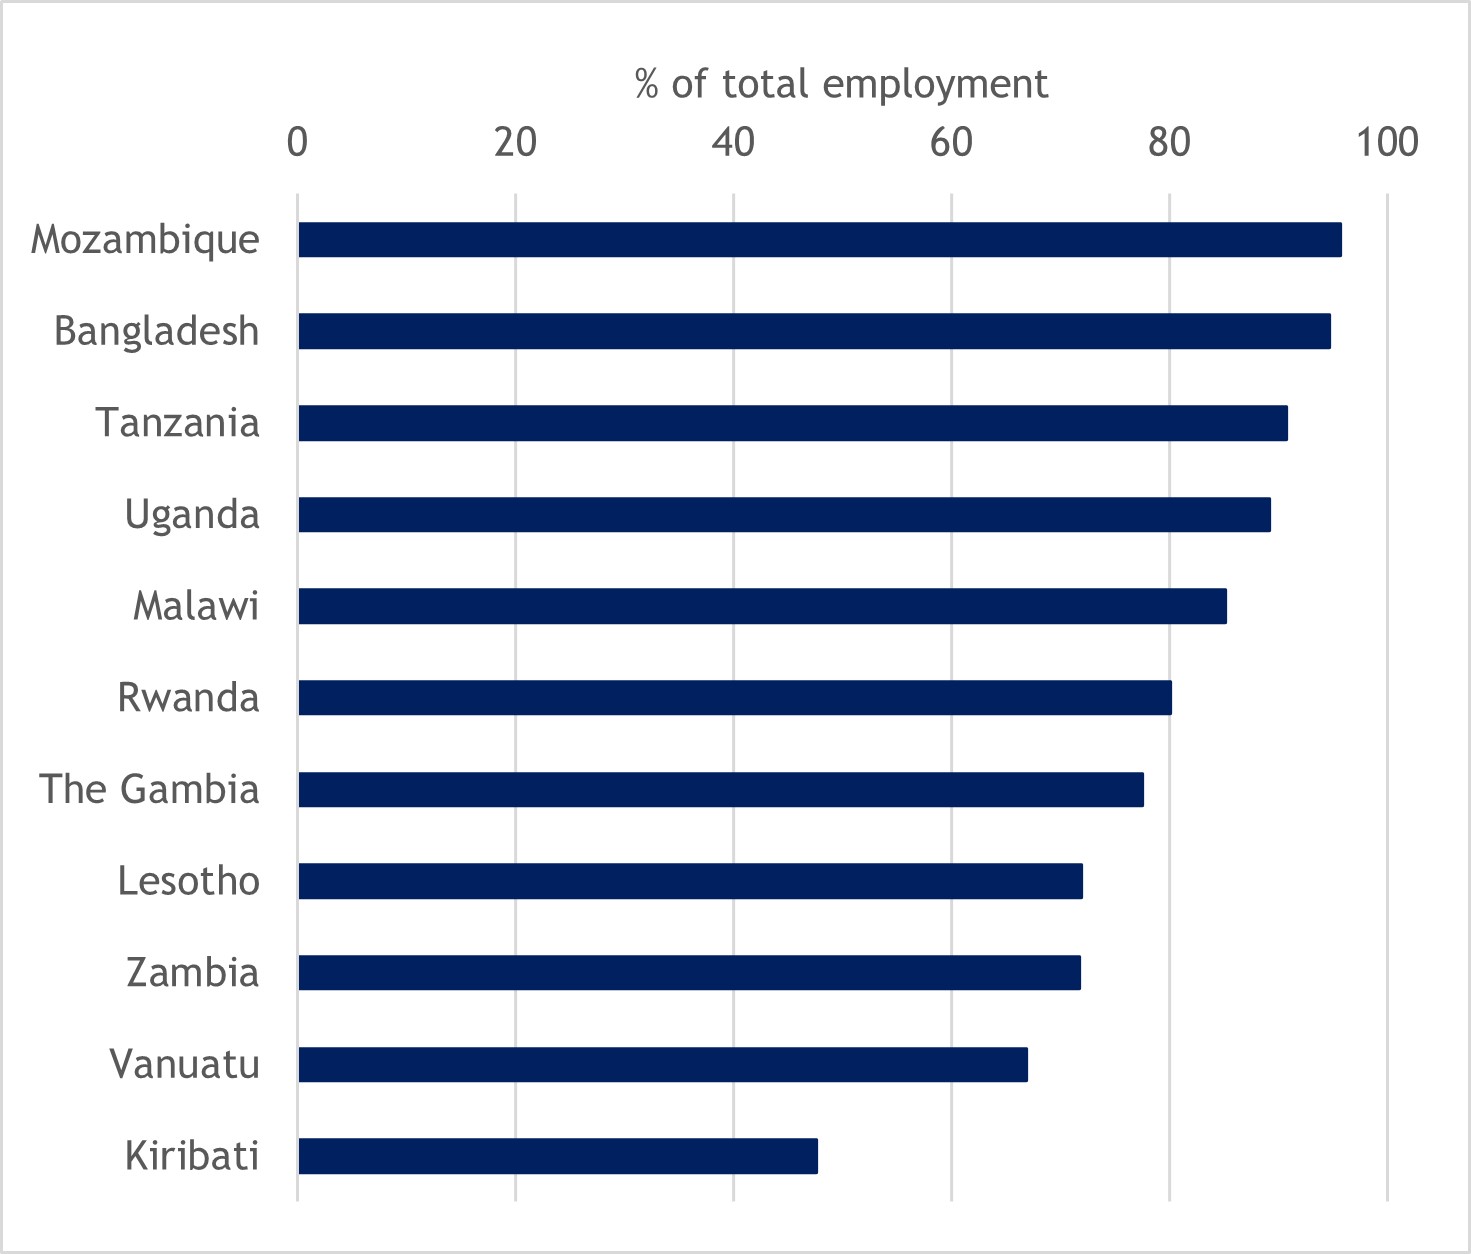
In many Commonwealth LDCs, particularly those in Africa, the informal sector employs a large share of the overall labour force. As of 2019 (or the latest available year), informal employment represented more than 90 per cent of total employment in Bangladesh, Mozambique and Tanzania; more than 80 per cent in Malawi, Rwanda and Uganda; and more than 70 per cent in The Gambia, Lesotho and Zambia (Figure 12). Those employed in the informal sector often face little or no job security, earn low wages, are unprotected by labour laws and do not have access to pensions or healthcare schemes. These high levels of informality also have broader economic implications: they reduce the scope for revenue collection via taxes and mean many economic activities take place outside of regulatory obligations.
Figure 12: Informal employment as a proportion of total employment in Commonwealth LDCs, 2019 or latest available year (%)
Source: ILO modelled estimates
2.2 Progress towards structural transformation in Commonwealth LDCs
The quality of infrastructure; the availability of energy supplies; scientific, digital and technological capabilities; and innovation and private sector development all have a significant bearing on the productive capabilities of LDCs. In turn, the process of structural transformation is linked intricately to the extent to which these countries can build productive capacity in higher-productivity activities. Structural economic transformation can be broadly understood as a process involving the movement of labour and other resources from lower- to higher-productivity activities, resulting in either within-sector productivity growth or a shift from lower- to higher-productivity sectors leading to structural changes in the economy. This may occur, for example, as labour moves from low-value primary agriculture to higher-value added agro-processing, thereby raising within-sector productivity growth. Alternatively, it may result from shifts in labour and other resources from low-productivity agriculture to higher-productivity manufacturing and services (representing between-sector productivity changes).
Economic transformation may also encompass broader structural transformations involving “fundamental changes in economic and social structures that advance inclusive and sustainable development,” with ensuing impacts on poverty and inequality (UNECA, 2018). The outcomes of such transformations include specific effects on employment, production and society:
- Employment — increased labour productivity, more decent work opportunities and improved education and skills;
- Production — greater diversification, technological upgrading contributing to accelerated productivity growth and adding value to production processes, stronger backward and forward linkages with deeper integration into the global economy and greater participation in global value chains (GVCs); and
- Society — stable demographic changes, improved health, more equitable social welfare systems and reduced poverty and inequality.
LDCs have historically faced a variety of binding constraints to structural transformation. These range from low productivity and limited capacity in manufacturing and other productive sectors, to a lack of economic diversification, high levels of dependence on commodities and natural resources, low investment rates and limited government capacity to implement growth-oriented structural policies (Delelegn, 2021; Paddisson, 2021; UNCTAD, 2021c; UNESCAP, 2021; UN-OHRLLS, 2020, 2021).
Addressing these constraints and sustaining economic transformation is crucial for the long-term development of LDCs and will be the main driver of their transition from low- to middle- and, ultimately, high-income status. It will also help ensure their economies are more resilient to future shocks.
With this in mind, advancing structural transformation was earmarked as a major priority on the IPoA agenda. This sub-section assesses the progress Commonwealth LDCs made towards economic transformation in the years from 2011 to 2019.
As explained above, aggregate labour productivity growth is the primary mechanism through which economic transformation is achieved. This is facilitated either by shifting labour and other resources from lower- to higher-productivity activities within a sector or by moving these resources from lower- to higher-productivity sectors (Balchin et al., 2019).
Figure 13 assesses labour productivity growth in Commonwealth LDCs, measured as three-year averages of annual growth rates in real GDP per employed person from 2011 to 2019. For most Commonwealth LDCs, aggregate labour productivity growth either stagnated or slowed during the course of the IPoA. Bangladesh, Lesotho, Mozambique, Tanzania and Zambia all witnessed a steady decline in these growth rates over the period, and Sierra Leone experienced a sharp reversal mid-way. Growth in labour productivity stagnated in Malawi, Rwanda and Uganda. Only The Gambia managed to record steady improvements in productivity growth between each of the three sub-periods.
Figure 13: Annual growth rate of real GDP per employed person, three-year averages, 2011-2019 (%)
Alongside sluggish productivity growth, scores for Bangladesh and Uganda deteriorated on the Economic Complexity Index (ECI)[1] between 2011 and 2019 (Figure 14). The performance of the other Commonwealth LDCs included in the ECI was mixed: Malawi and Zambia managed to climb several places up the rankings, whereas Tanzania and Uganda both dropped down the list. Only Tanzania, Malawi and Zambia were able to increase their ECI scores between 2011 and 2019.
Figure 14: ECI values and rankings, selected Commonwealth LDCs, 2011 and 2019
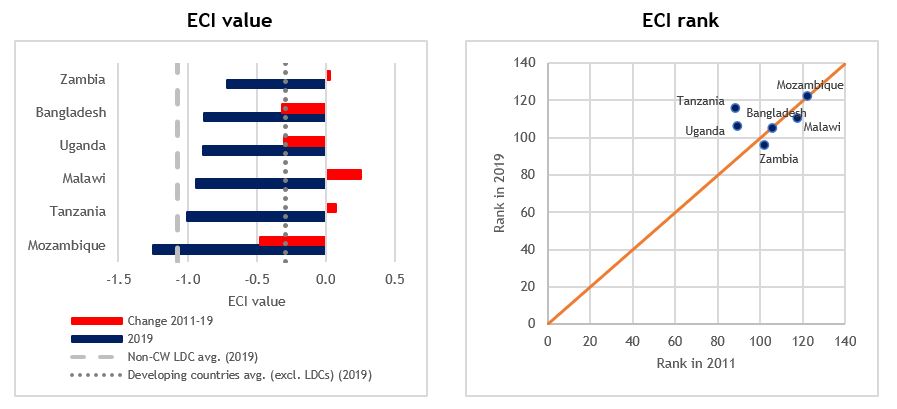
Source: Atlas of Economic Complexity, Harvard University
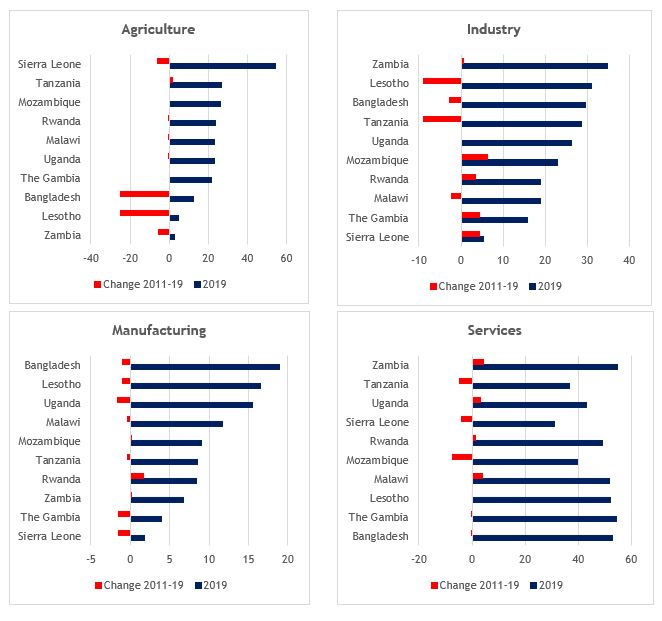
At the sectoral level, economic transformation is reflected in shifts towards higher value added activities. Figure 15 considers these changes between sectors in Commonwealth LDCs by comparing the respective shares of agriculture, industry, manufacturing and services value added in each economy in 2019 and examining changes in these shares over the pre-pandemic period of IPoA implementation. Agricultural value added still accounts for large shares of economic output in many Commonwealth LDCs, ranging from more than 20 per cent of GDP in The Gambia, Malawi, Mozambique, Rwanda, Tanzania and Uganda to as much as 54 per cent in Sierra Leone. Only Bangladesh and Lesotho, and to a lesser extent Sierra Leone and Zambia, recorded significant declines in the share of agricultural value added in GDP between 2011 and 2019.
Despite the significance of agriculture, value added generated in the services sector was the dominant contributor to GDP in all Commonwealth LDCs in 2019, except for Sierra Leone. The contributions from services ranged from 37 per cent in Tanzania and 40 per cent in Mozambique to more than 50 per cent in Bangladesh, The Gambia, Lesotho, Malawi and Zambia. In the cases of Zambia, Malawi and Uganda, increasing contributions from services value added coincided with notable declines in the GDP contributions from agriculture, industry and manufacturing value added, respectively. The opposite occurred in Tanzania, where an increase in the contribution of agricultural value added to GDP was accompanied by declining contributions from both industry and services.
The shares of industry value added were largest in Zambia, followed by Lesotho, Bangladesh and Tanzania, ranging from 30 to 35 per cent of GDP in 2019. However, the industry value added contributions were still lower compared with 2011 in all three of these countries. In contrast, Mozambique, Sierra Leone, The Gambia and Rwanda recorded the largest increases in the contributions of industry value added to GDP over this period, with the growth in the case of Sierra Leone occurring off a very small base in 2011. Even so, industry value added still accounted for less than 20 per cent of GDP in The Gambia, Sierra Leone and Malawi in 2019.
None of the Commonwealth LDCs came close to achieving the IPoA target of doubling the manufacturing value added share in GDP. Indeed, this share remained low in most Commonwealth LDCs as of 2019 – less than 5 per cent in Sierra Leone and The Gambia and under 10 per cent in Mozambique, Rwanda, Tanzania and Zambia. Manufacturing shares exceeded 15 per cent in only three Commonwealth LDCs in 2019 – Bangladesh, Lesotho and Uganda – and in all three cases these shares were lower than in 2011. Overall, for seven of the 10 Commonwealth LDCs included in Figure 15, the share of manufacturing value added in GDP declined between 2011 and 2019. In Bangladesh, Tanzania and Uganda, and to a lesser extent Sierra Leone, Malawi and Lesotho, this occurred even amid relatively strong annual growth in manufacturing value added between 2011 and 2019 (Figure 16), suggesting this growth was outpaced by growth in other sectors.
When taken together with the declining shares of industry value added in GDP in Bangladesh, Malawi, Lesotho and Tanzania, there is evidence of a relative de-industrialisation of these economies during the course of IPoA implementation. This is consistent with wider trends observed across many LDCs over a longer time period stretching back to 1995 (see UNCTAD, 2021c).
Overall, the charts in Figure 15 and Figure 16 reveal a mixed picture of structural transformation in Commonwealth LDCs during the IPoA period. While there is some evidence of a shift in the weight of value added away from agriculture, in several cases this was accompanied by a relative increase in the value added share of services in GDP and stagnant or declining shares for industry and/or manufacturing. Growing manufacturing capacity and accelerating industrial development remains challenging for the majority of Commonwealth LDCs.
Figure 15: Shares of agriculture, industry, manufacturing and services value added in GDP in Commonwealth LDCs, 2019 and percentage point change 2011-2019 (%)
Source: Commonwealth Secretariat (calculated using data from World Bank World Development Indicators)
Figure 16: Relative evolution of the manufacturing sector in Commonwealth LDCs, 2011-2019
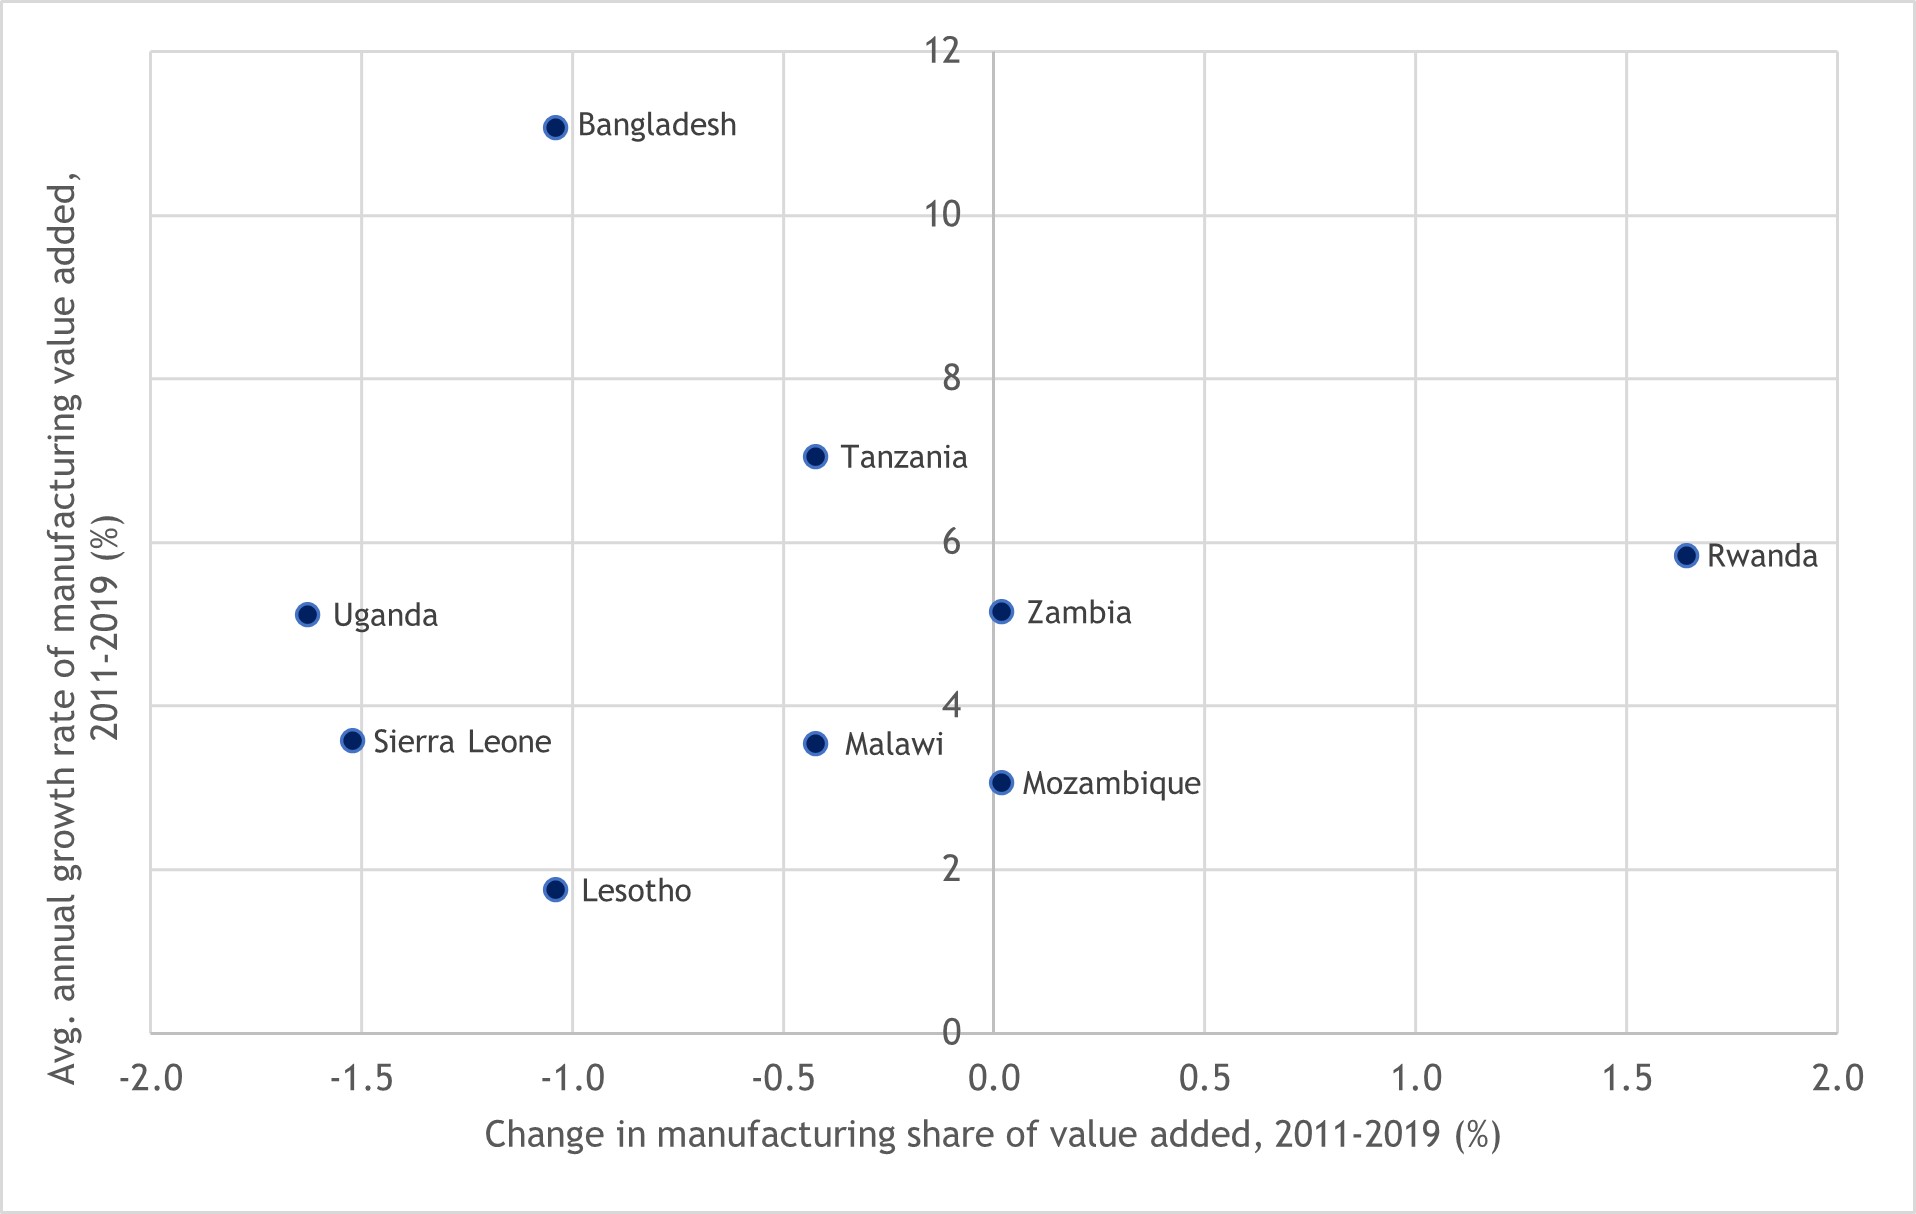
Source: Commonwealth Secretariat (calculated using data from World Bank World Development Indicators)
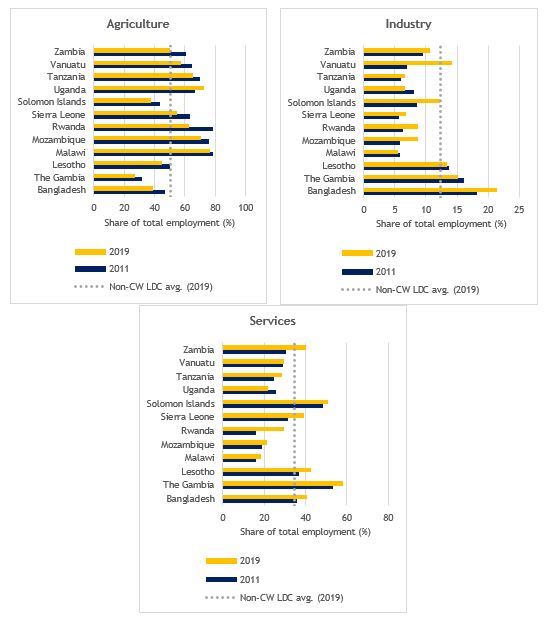
Broad progress in economic transformation can be discerned more clearly from Figure 17, which compares the contributions of the agriculture, industry and services sectors to total employment in Commonwealth LDCs in 2011 and 2019. In almost all Commonwealth LDCs, except for Uganda, there is clear evidence of a shift in the relative shares of employment away from agriculture and into industry and services. This is consistent with the broad concept of structural transformation whereby labour moves from lower-productivity agricultural activities and into higher-productivity industry and services sectors. Relative movements in employment away from agriculture were largest in Rwanda, Zambia, Sierra Leone and Bangladesh between 2011 and 2019. In turn, the relative increases in employment shares in industry were largest in Vanuatu, Solomon Islands, Bangladesh and Mozambique; in the case of services they were most substantial in Rwanda, Zambia, Sierra Leone and Lesotho.
Figure 17: Shares of agriculture, industry and services in total employment in Commonwealth LDCs, 2011 vs. 2019 (%)
2.3 Outstanding issues not fully addressed under the IPoA
The evidence presented in the preceding sections points to broad progress across the Commonwealth LDC group during the pre-pandemic IPoA years in improving infrastructure, enhancing access to the internet and other digital technologies and, to a more limited extent, developing the private sector. Despite these achievements, several persistent – and in some cases binding – constraints continue to stall the economic transformation necessary to generate a step-change to a more sustainable growth path characterised by higher incomes, more productive employment, continued poverty reduction and higher levels of economic, human and social development. This is especially clear from the evidence presented in Section 2.2, which shows that progress on economic transformation generally remains worryingly slow in Commonwealth LDCs.
Commonwealth LDCs continue to confront challenges to adopt and harness technology, which constrains their ability to boost productivity and engage in more advanced, higher-value added production. In much the same manner as the overall LDC group, this owes to a lack of accumulated technological capabilities as well as infrastructure deficiencies and skills shortages (Traeger, 2021; UNESCAP, 2021). These shortcomings are especially evident in the areas of digital infrastructure, digital skills and digital literacy, where generally low levels of access to the internet, exacerbated by high costs and limited digital capabilities, are contributing to widening digital divides both within LDCs and between LDCs and their more developed counterparts.
The skills limitations extend beyond the digital realm. Skills shortages and mismatches translate into employability gaps in both traditional and emerging sectors, which, in turn, hamper efforts towards economic diversification (UNCTAD, 2021c). This makes it difficult for Commonwealth LDCs to develop capabilities in new, more productive and higher-value added economic activities.
Their progress in developing productive capacity is hamstrung further by generally weak capabilities in science, technology and innovation. This is evident, for example, in the very low numbers of trademark and patent applications originating from Commonwealth LDCs (Bangladesh aside). The poor state of science, technology and innovation in these countries is, in part, a product of low levels of investment and expenditure on research and development as well as limited supplies of high-skilled labour and underdeveloped policy and regulatory environments (UN-OHRLLS, 2021).
Large deficits in economic infrastructure also act as a brake on private sector development. In many of the Commonwealth’s African LDCs, for example, even though improvements have been made since the start of the IPoA, low levels of access to electricity, coupled with unreliable electricity supplies, continue to undermine competitiveness and constrain productive activity. In many of these countries, technical and financial capacity gaps hamper initiatives that aim to address these challenges by scaling up the supply of renewable energy (UN-OHRLLS, 2020).
In most instances, these constraints are not unique to Commonwealth LDCs but are rather symptomatic of the challenges facing the entire LDC group. They contribute to the growth paradoxes observed in many of these countries. Even as economic growth has continued (albeit at rates below the target envisaged in the IPoA), trade has expanded (see Chapter 3), income levels have risen, investment has grown (see Chapter 4) and Commonwealth LDCs have registered progress on several other goals and targets set out in the IPoA (Box 1), social and human development outcomes remain poor and their economies have undergone few structural changes (UN-OHRLLS, 2020; Delelegn, 2021). As a result, most Commonwealth LDCs remain highly vulnerable, lacking the resilience to withstand external shocks. It will therefore be critical to make more discernible progress in overcoming the many structural impediments highlighted in this chapter over the course of the next decade.
|
Box 1: Human and social development in LDCs – progress and remaining challenges The IPoA sought to advance human and social development in LDCs through improved education and health, better access to water and sanitation, higher levels of social protection and more empowerment of women and youths. As a group, LDCs made strong progress in many of these areas over the decade. Maternal and infant mortality rates declined, access to drinking water and sanitation services expanded, educational outcomes improved and literacy rates increased. Despite these gains, LDCs continued to face major human and social development challenges even as the IPoA drew to a close. A further 9 million people in LDCs fell into extreme poverty between 2010 and 2018 (with the total reaching 349 million) and the poverty gap began to narrow at a slower rate (UN-OHRLLS, 2021). Large shares of people living in LDCs lacked access to education and more than 350 million did not have basic reading and writing skills (ibid.). Food insecurity remained a persistent challenge: more than half of the people living in LDCs faced moderate or severe food insecurity in 2019, up from 46 per cent in 2014 (ibid.). How did Commonwealth LDCs fare during the IPoA? Moderate or severe food insecurity increased in the second half of the IPoA in most Commonwealth LDCs and remained especially problematic for members in Africa. More than half of the populations of The Gambia, Uganda and Zambia faced food insecurity in 2019, and these levels were as high as 71 per cent in Mozambique, 82 per cent in Malawi and 84 per cent in Sierra Leone. All 14 Commonwealth LDCs improved their scores on the Human Development Index (HDI). However, as of 2020, human development levels were still regarded as low – reflected in HDI scores below 0.55 – in 10 of these countries. Only Bangladesh, Kiribati, Tanzania and Vanuatu managed to attain medium levels of human development by the end of the IPoA. Mean years of schooling increased in 13 Commonwealth LDCs. The Commonwealth LDC average climbed from 4.8 years in 2011 to 5.5 years in 2020, well above the average for non-Commonwealth LDCs (4.1 years in 2020) but still far short of the figure for other developing countries (8.8 years). Similarly, literacy rates improved in several Commonwealth LDCs at various points over the IPoA implementation period. The most notable increase was registered in Bangladesh, where the adult literacy rate rose by nearly 16 percentage points between 2011 and 2019. The limited available data shows that poverty levels remained high in several Commonwealth LDCs towards the end of the IPoA. More than 70 per cent of the population in Malawi was living under the poverty line (US$1.90 a day) in 2018, along with more than half in Rwanda and Zambia (2017 data). More encouraging progress was made in eradicating poverty in Bangladesh and The Gambia, where the poverty headcount ratios fell from 18.2 to 7.7 per cent and from 27.5 to 9.1 percent, respectively, between 2011 and 2018. Access to basic drinking water expanded in all Commonwealth LDCs. On average, 70 per cent of the population in these countries enjoyed access in 2019, up from 64 per cent in 2011. However, accessing drinking water remains challenging in some African LDCs: less than 60 per cent of people in Mozambique, Rwanda and Tanzania had access in 2019 and under half in Uganda. Access to basic sanitation increased in all but two of the Commonwealth LDCs (The Gambia and Vanuatu). Even so, very few people had access to basic sanitation in Sierra Leone (16 per cent of the population) and Uganda (18.5 per cent) as of 2019. Health outcomes generally improved in Commonwealth LDCs during the course of the IPoA. Life expectancy at birth increased in all 13 Commonwealth LDCs with available data up to 2019. At the same time, infant mortality rates declined in all Commonwealth LDCs over the course of the pre-COVID IPoA years. These improved outcomes were matched by increases in health expenditure per capita in eight Commonwealth LDCs up to 2019. Yet health expenditures varied widely across Commonwealth LDCs, from very low levels in The Gambia (only US$22 per capita), Malawi and Tanzania (both less than $40), to nearly $200 in Kiribati and close to $700 in Tuvalu in 2019. The average health expenditure per capita in Commonwealth LDCs ($118) was more than double the level in non-Commonwealth LDCs ($53) in 2019. The onset of COVID-19 in 2020 and its devastating social and economic consequences threaten to reverse some of these achievements (see Box 3). The next programme of action for LDCs needs to accord priority to tackling the multiple and concurrent setbacks stemming from the pandemic if it is to help sustain progress on advancing human and social development. Source: Commonwealth Secretariat (based on data presented in Annex Table A1) |
[1] A country’s score on the ECI is calculated based on the diversity and complexity of its export basket (see https://atlas.cid.harvard.edu/glossary for a technical discussion of the construction of the index).