LDCs have historically faced significant challenges mobilising the resources necessary to finance interventions to support their development needs. These challenges range from major financing and investment gaps, compounded by low levels of private investment and limited inflows of foreign direct investment (FDI), to insufficient domestic financial resources and a narrow fiscal base (UNESCAP, 2021). Consequently, most LDCs rely heavily on financial support through official development assistance (ODA) and many face rising external debt and heightened risk of debt distress (UN-OHRLLS, 2020, 2021).
A key priority for the IPoA was to enhance the capacity of LDCs to mobilise financial resources for development and capacity-building. This focused on five different means of generating financing inflows: domestic resource mobilisation, external debt, FDI, ODA and remittances. This section examines progress in Commonwealth LDCs in each of these areas across the pre-pandemic period of IPoA implementation.
4.1 Domestic resource mobilisation
LDCs as a group tend to have limited capacity to generate their own domestic revenue. Across all LDCs globally, growth in the median tax-to-GDP ratio was sluggish for much of the IPoA implementation period, climbing from 13.3 per cent in 2011 to 16.2 per cent in 2018 and remaining well short of equivalent levels in higher-income countries (UN-OHRLLS, 2021). Weak tax administrations, underdeveloped tax systems, narrow fiscal bases accentuated by high poverty rates and undiversified economic structures are among the primary reasons for low tax collection in LDCs (ibid.).
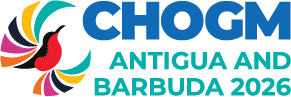
The relative scale of tax revenue collections varied widely across Commonwealth LDCs during the IPoA period. Tax revenue-to-GDP ratios exceeded 30 per cent, on average, in Lesotho between 2011 and 2019, and were above 20 per cent in Kiribati, Mozambique and Solomon Islands (Figure 25). In contrast, these average ratios were considerably lower in Bangladesh (8.8 per cent),[1] Tanzania (11 per cent), Uganda (11.5 per cent), Rwanda (13.8 per cent), Malawi (14.1 per cent) and Zambia (15.1 per cent), all of which fell below the average for non-Commonwealth LDCs (15.7 per cent). As with many LDCs, limited tax administration capacity and the presence of large informal economies constrain tax revenue collection in these countries (UN-OHRLLS, 2021). Despite these difficulties, it is encouraging that, except for Lesotho, Solomon Islands and Malawi, the eight other Commonwealth LDCs with available data managed to maintain or improve their average tax revenue-to-GDP ratios in the second half of the pre-pandemic IPoA period (2016-2019).
Figure 25: Tax revenue as a share of GDP in Commonwealth LDCs, 2011-2015 and 2016-2019 averages (%)
Source: Commonwealth Secretariat (calculated using World Bank World Development Indicators data)
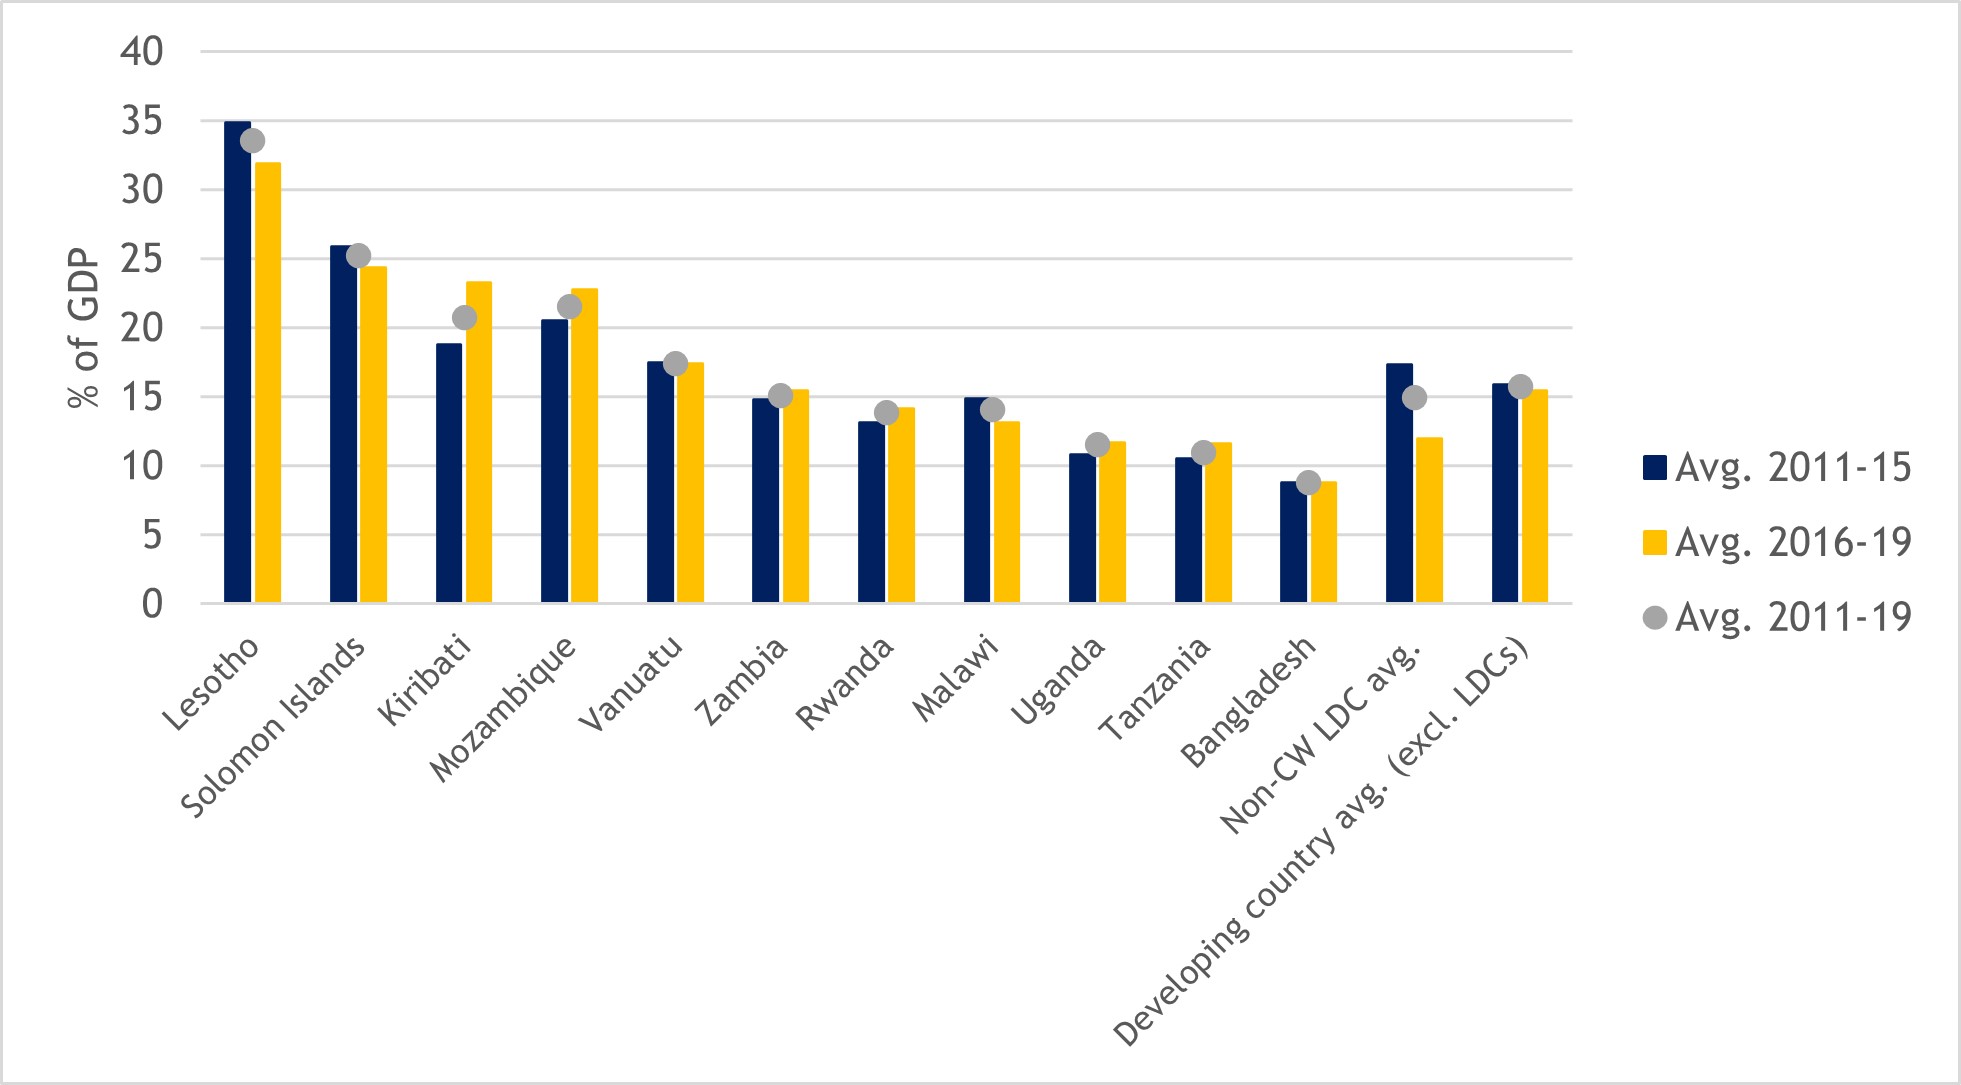
In addition to revenues generated via taxation, domestic savings can also serve as a crucial source of domestic financing. High domestic savings rates have long been held as important for mobilising funds for investment and sustaining economic growth in developing countries (Shimomura, 1995; Thirlwall, 2002). Figure 26 shows that Commonwealth LDCs achieved mixed success in mobilising domestic savings during the pre-pandemic period of IPoA implementation. Average gross domestic savings exceeded 35 per cent of GDP in Zambia and were close to 27 per cent of GDP in Tanzania between 2011 and 2019, in both cases eclipsing the average for other developing countries. They also matched the level of other developing countries in Bangladesh and Vanuatu. Yet, in some Commonwealth LDCs, such as The Gambia and Malawi, gross domestic savings remained very limited relative to GDP. In three others (Kiribati, Lesotho and Sierra Leone), final consumption expenditure exceeded GDP, on average, between 2011 and 2019, resulting in negative gross domestic savings relative to GDP. Limited mobilisation of domestic savings is generally a product of the interrelated effects of low per capita incomes, underdeveloped domestic financial sectors, a lack of inclusivity in financial systems and weak banking oversight (UNESCAP, 2021). The resulting low – or negative – levels of domestic savings in these countries are likely to have constrained investment, production and employment during the IPoA.
Figure 26: Gross domestic savings as a share of GDP in Commonwealth LDCs, average 2011-2019 (%)
Source: World Bank World Development Indicators
4.2 External debt
In the absence of means to mobilise sufficient domestic financial resources, many LDCs have accumulated substantial levels of external debt. Such high levels of external indebtedness heighten the burden of debt service and place some LDCs at risk of debt distress. Recognising these difficulties, the IPoA set the ambitious goal of attaining long-term debt sustainability in all LDCs (Schroderus-Fox, 2017).
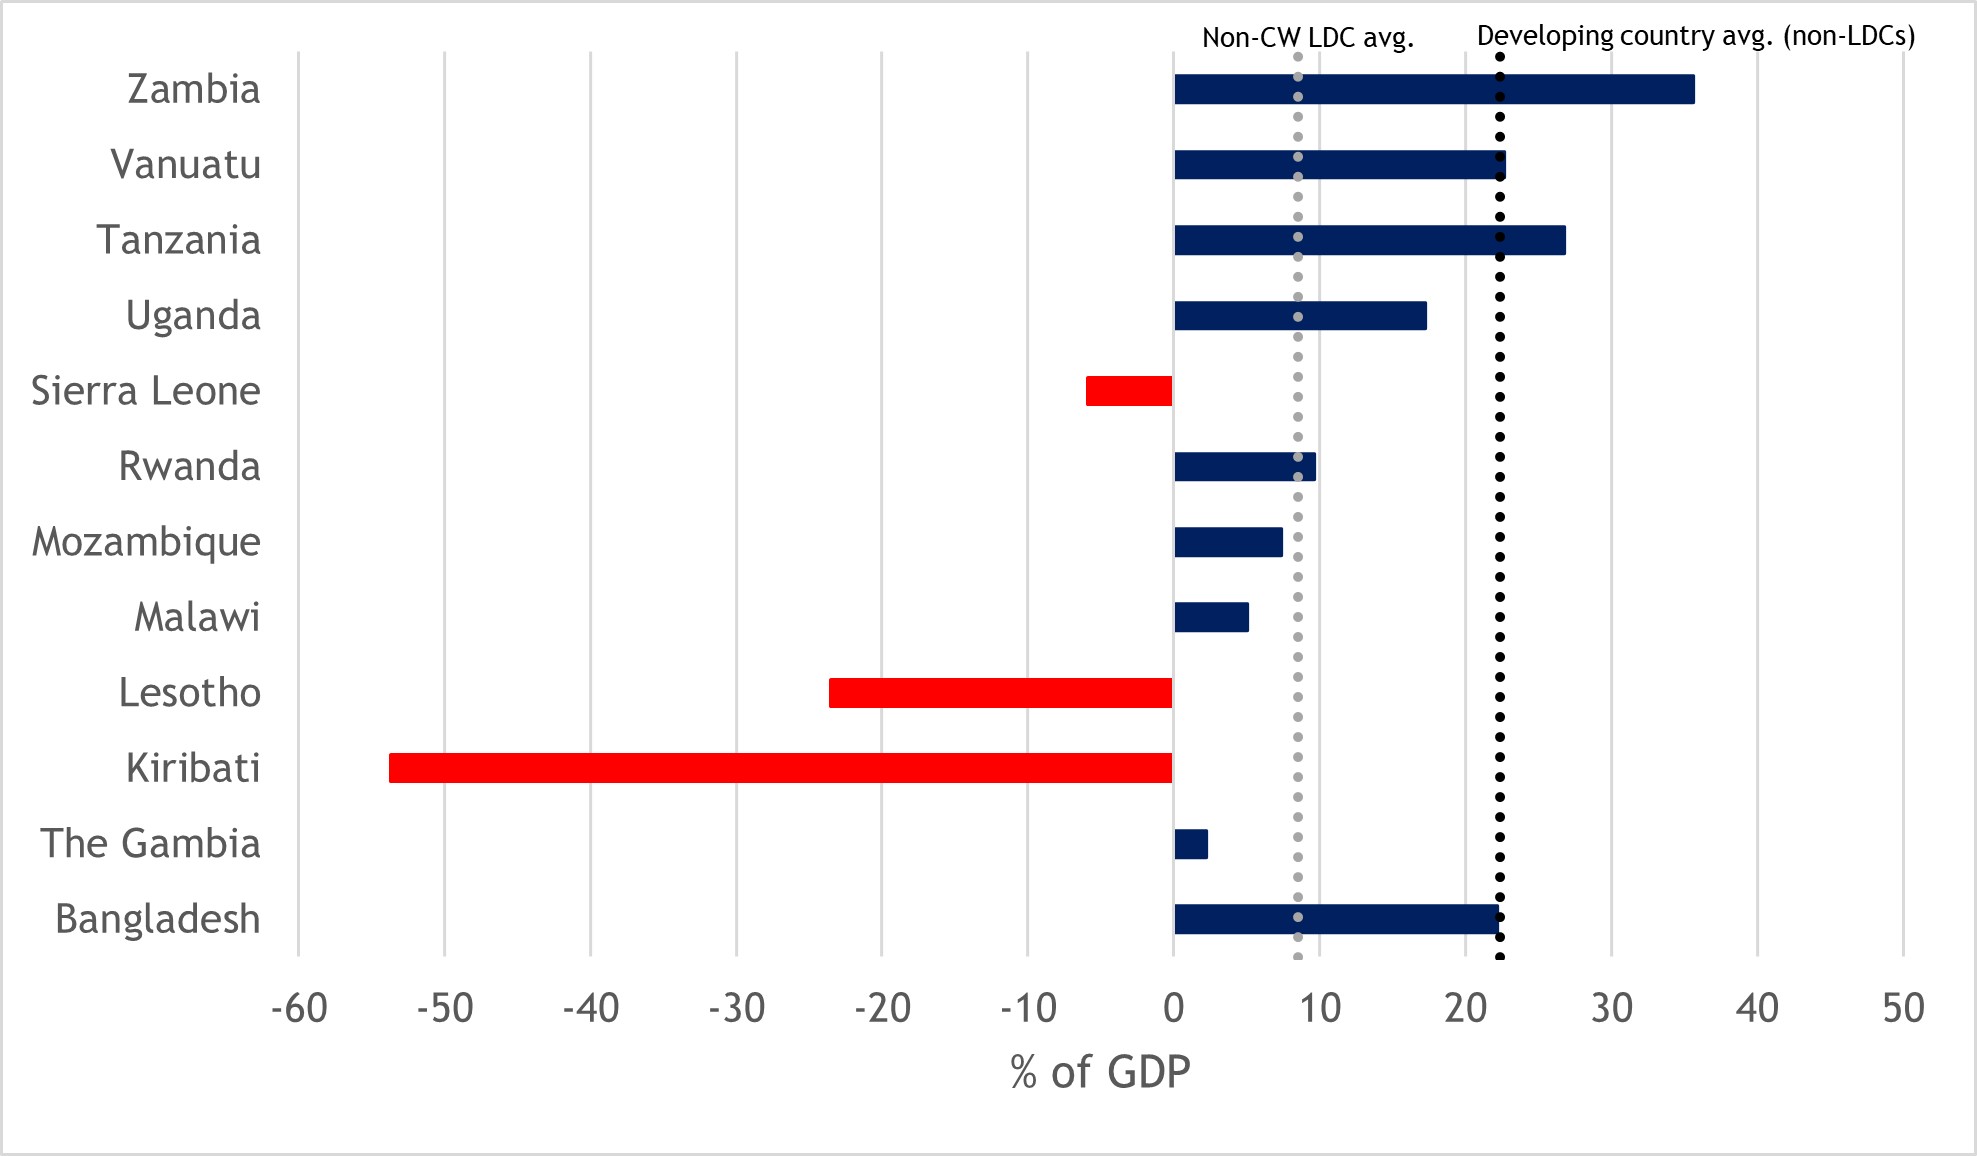
Despite this, external debt stocks increased steadily relative to gross national income (GNI) in almost all the Commonwealth LDCs between 2011 and 2019 (Figure 27). The increase in external debt stock was especially large in Mozambique, rising by 73 percentage points to nearly 126 per cent of GNI in 2019; these stocks also expanded significantly in Zambia, Rwanda, Uganda and Vanuatu. Only Bangladesh and Solomon Islands managed to reduce their external debt stocks relative to GNI when comparing 2011 and 2019 levels.
With rising levels of external debt, some Commonwealth LDCs faced rapidly expanding debt service burdens during the pre-pandemic years of the IPoA. Levels of debt service on external debt grew at annual rates of 44 and 49 per cent in Zambia and Tanzania between 2011 and 2019, and also increased at a rapid pace in Mozambique (35 per cent annual growth), Uganda (25 per cent) and Rwanda (24 per cent) (Figure 28). The cost of debt service on external debt increased from 2011 to 2019 in all Commonwealth LDCs except for Solomon Islands. This is consistent with the experience of LDCs globally, where expanding debt stocks and mounting debt service burdens were a feature of the IPoA years (UN-OHRLLS, 2020; UNESCAP, 2021).
Figure 27: External debt as a share of GNI in Commonwealth LDCs, 2011-2019 (%)
Figure 28: Debt service on external debt in Commonwealth LDCs, 2011-2019 (current US$ million)
Source: World Bank World Development Indicators
Table 7 examines the sustainability of the debt burdens Commonwealth LDCs faced during the pre-pandemic years of the IPoA, providing an indication of the buffer in place for these countries to service their external debt. Bangladesh, Malawi, Solomon Islands and Vanuatu managed to expand their total reserves as a percentage of external debt when comparing 2011 and 2019 levels, with the largest increases in Bangladesh (23 percentage points) and Vanuatu (24 percentage points). In contrast, reserves in all eight of the other Commonwealth LDCs with available data declined relative to their total external debt. The decline was especially severe in Uganda (80 percentage points), while declines in excess of 40 percentage points were observed in The Gambia and Zambia. As of 2019, total reserves as a percentage of external debt ranged from as high as 163 per cent in Solomon Islands and 122 per cent in Vanuatu, to as low as 5 per cent in Zambia and 19 per cent in Mozambique. These two countries, and others such as Rwanda and Sierra Leone to a lesser extent, have less flexibility to react to future needs or adverse and unexpected events that may require them to reduce the level of debt they owe to external creditors.
Table 7: Total reserves in Commonwealth LDCs as a share of total external debt, 2011-2019 (%)
|
Country |
2011 |
2012 |
2013 |
2014 |
2015 |
2016 |
2017 |
2018 |
2019 |
Annual avg. 2011-2019 |
pp. change 2011 vs. 2019 |
|
Bangladesh |
33.9 |
45.1 |
57.4 |
68.3 |
76.5 |
83.9 |
71.4 |
61.4 |
57.3 |
61.7 |
23.3 |
|
The Gambia |
44.1 |
43.6 |
38.2 |
30.4 |
20.8 |
16.6 |
25.4 |
27.5 |
30.8 |
-44.1 |
|
|
Lesotho |
113.0 |
117.2 |
117.0 |
120.3 |
108.2 |
100.4 |
70.3 |
80.6 |
82.7 |
101.1 |
-30.2 |
|
Malawi |
17.9 |
18.4 |
27.4 |
37.0 |
39.4 |
32.9 |
35.6 |
33.5 |
33.9 |
30.7 |
16.0 |
|
Mozambique |
39.9 |
39.7 |
25.5 |
23.6 |
17.9 |
15.1 |
21.0 |
17.3 |
19.1 |
24.3 |
-20.8 |
|
Rwanda |
49.1 |
26.2 |
28.3 |
32.5 |
26.6 |
23.5 |
24.4 |
25.0 |
23.6 |
28.8 |
-25.5 |
|
Sierra Leone |
41.8 |
35.8 |
38.1 |
42.0 |
37.3 |
30.8 |
31.7 |
28.9 |
29.3 |
35.1 |
-12.5 |
|
Solomon Islands |
160.1 |
218.7 |
255.2 |
264.5 |
250.4 |
194.8 |
152.4 |
190.7 |
163.1 |
205.5 |
3.0 |
|
Tanzania |
37.2 |
34.8 |
35.3 |
30.0 |
26.5 |
26.6 |
32.2 |
27.3 |
|
31.2 |
-37.2 |
|
Uganda |
80.2 |
83.9 |
39.0 |
38.3 |
30.4 |
30.7 |
31.9 |
27.3 |
45.2 |
-80.2 |
|
|
Vanuatu |
97.4 |
100.0 |
113.1 |
90.5 |
104.8 |
91.1 |
98.4 |
104.6 |
121.6 |
102.4 |
24.2 |
|
Zambia |
46.8 |
53.2 |
42.6 |
33.5 |
25.2 |
15.5 |
12.0 |
8.3 |
5.3 |
26.9 |
-41.5 |
|
CW LDC avg. |
63.5 |
68.0 |
68.1 |
67.6 |
63.7 |
55.2 |
50.6 |
52.7 |
59.5 |
61.0 |
-3.9 |
|
Non-CW LDC avg. |
64.3 |
111.0 |
95.5 |
71.2 |
71.4 |
67.5 |
73.6 |
72.8 |
69.5 |
77.4 |
5.2 |
|
Developing country avg. (excl. LDCs) |
116.6 |
123.0 |
124.3 |
113.5 |
106.8 |
87.7 |
83.1 |
75.9 |
73.5 |
100.5 |
-43.2 |
Note: No data available for Kiribati and Tuvalu.
Source: World Bank World Development Indicators
4.3 Foreign direct investment in Commonwealth LDCs
FDI has the potential to make a significant contribution to growth, development and prosperity in Commonwealth LDCs. It can play an important role in facilitating the transfer of technology and skills, creating jobs and building productive capacity, especially in LDCs, where stocks of domestic capital and savings tend to be insufficient to finance productive investments (Commonwealth Secretariat, 2021). FDI may also make it easier for domestic firms in LDCs to integrate into international production networks and access foreign markets via involvement in cross-border supply chains (Alfaro, 2016; Gonzalez, 2017). These effects can support the necessary upgrading to higher-productivity, higher-value added activities that enables economic transformation.
Given these potentially positive effects, it is concerning that net FDI inflows, when measured as a percentage of GDP, generally followed a downward trajectory in most Commonwealth LDCs during the pre-pandemic years of the IPoA (Figure 29). Average net inflows declined relative to GDP in Malawi, Mozambique, Tuvalu and Zambia across consecutive three-year periods, and were lower in 2017-2019 compared with 2011-2013 in all but two of the remaining Commonwealth LDCs (Lesotho and Rwanda). These trends are consistent with declines in net FDI observed within the wider LDC group (UNESCAP, 2021) and occurred despite an increase of 0.5 percentage points in the share of global FDI inflows directed to the world’s LDCs between 2011 and 2018 (UN-OHRLLS, 2020).[2]
Figure 29: Net FDI inflows to Commonwealth LDCs as a share of GDP, 2011-2019 (%)
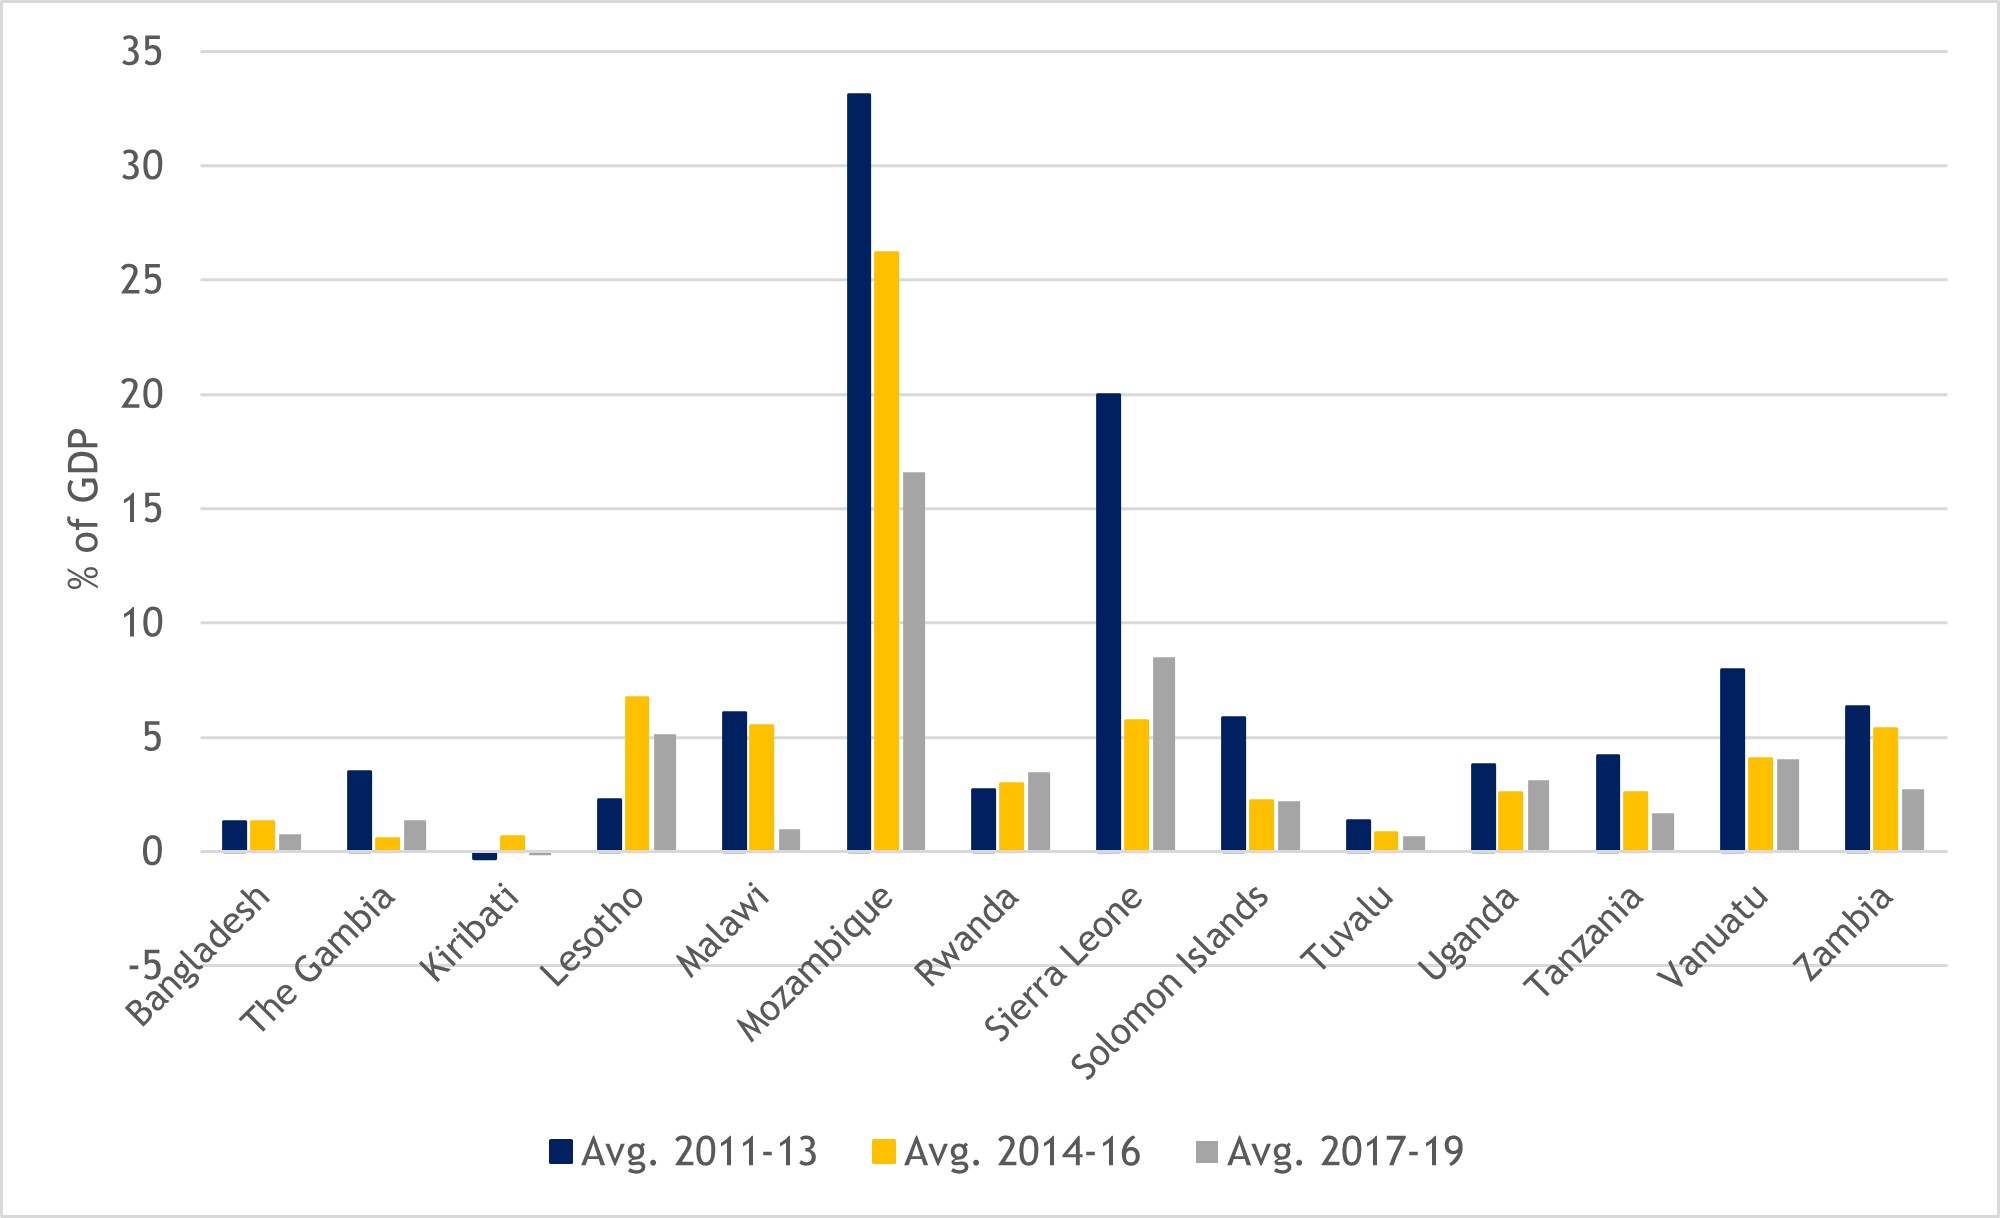
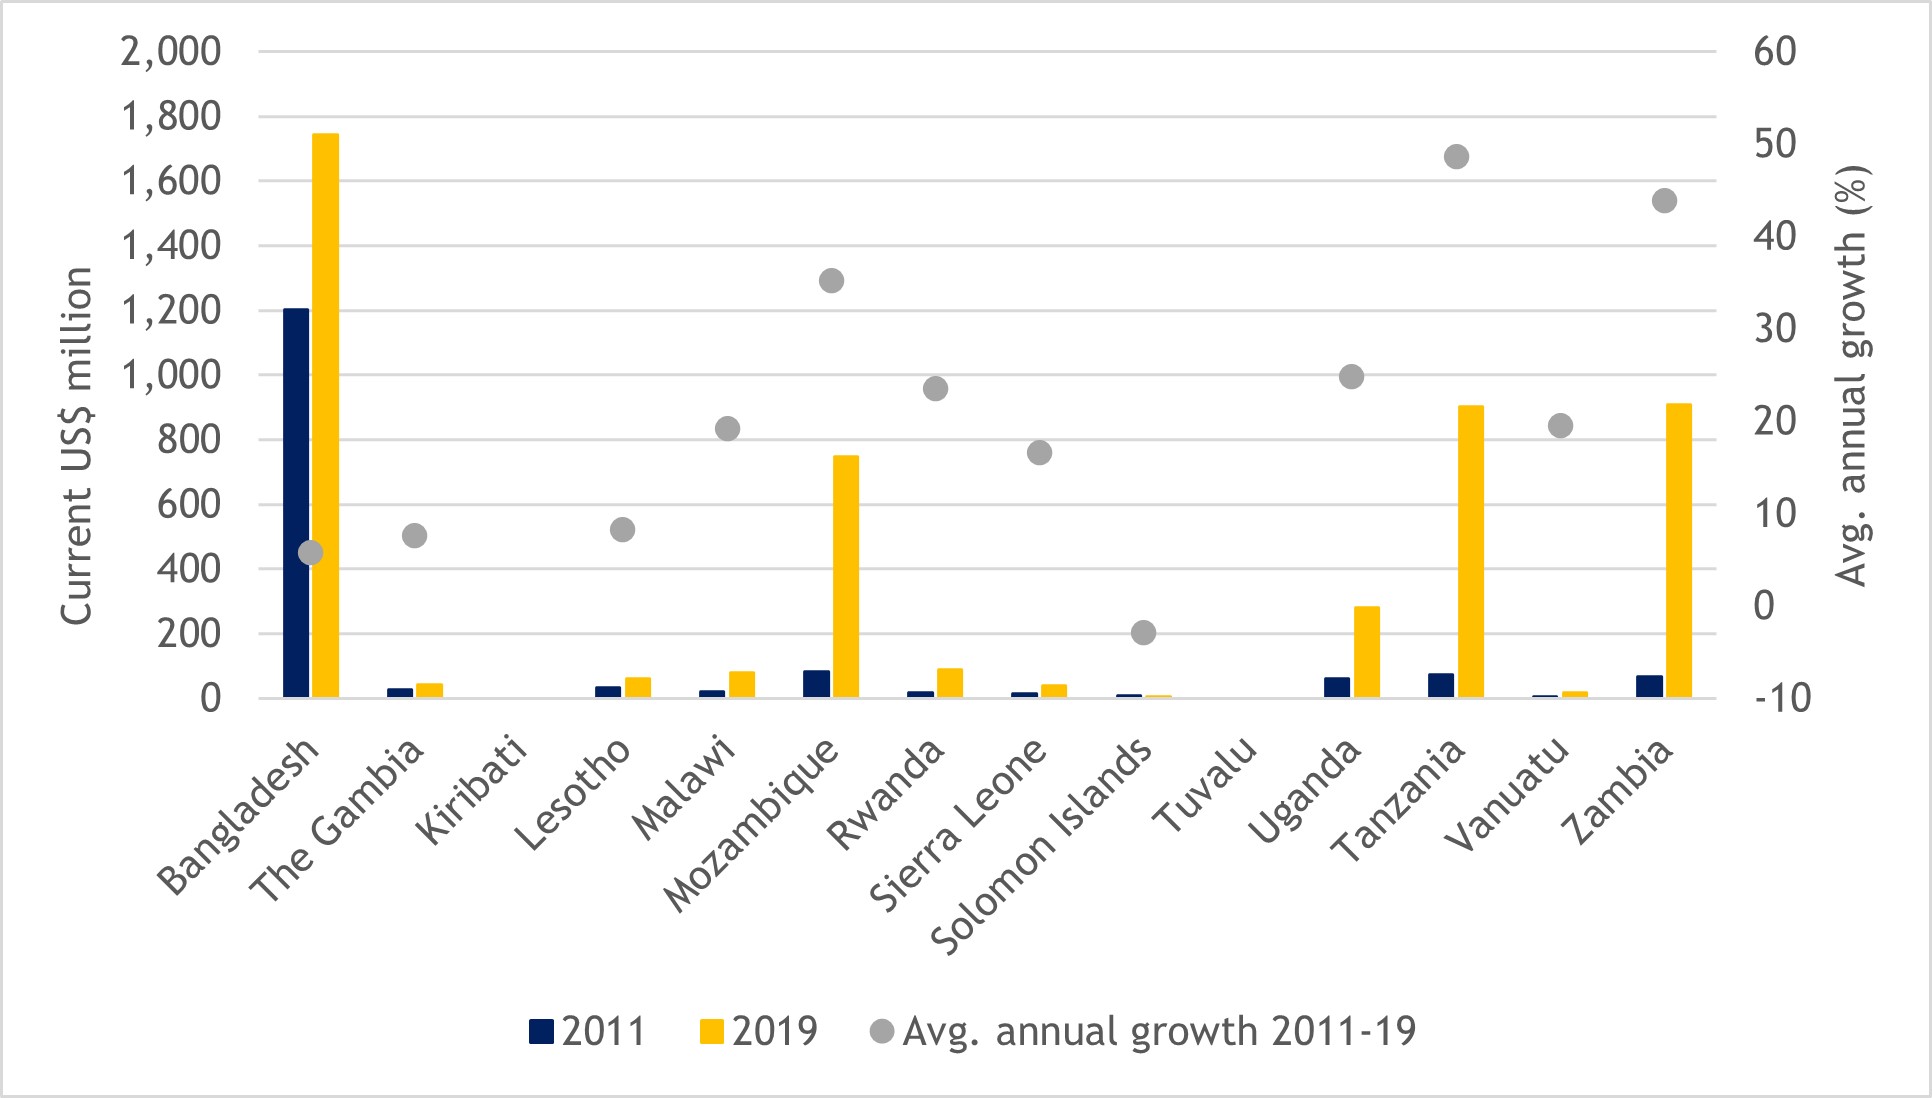
Table 8 presents a more detailed breakdown of the value of FDI inflows to Commonwealth LDCs. In absolute terms, Bangladesh, Mozambique and Tanzania attracted the most FDI on a cumulative basis over the course of the pre-pandemic IPoA years. These three countries collectively accounted for more than one-quarter (28.8 per cent) of all global FDI directed to the broader LDC group between 2011 and 2019. Even so, among Commonwealth LDCs, FDI inflows to Malawi, Vanuatu, Rwanda and Lesotho grew fastest, on average, over this period. Average annual growth in FDI inflows was sluggish in several other Commonwealth LDCs, particularly Tanzania and Zambia (both below the average for the LDC group), and negative in the case of The Gambia, Kiribati, Mozambique, Sierra Leone and Tuvalu. The volatile and uneven distribution of FDI inflows to many Commonwealth LDCs during the IPoA period is likely to have constrained efforts to develop productive capacity in these countries.
Table 8: Value of FDI inflows to Commonwealth LDCs, 2011-2019 (US$ million)
|
Country |
2011 |
2012 |
2013 |
2014 |
2015 |
2016 |
2017 |
2018 |
2019 |
Avg. growth rate 2011-2019 (%) |
Cumulative total 2011-2019 (US$ million) |
Share of LDC cum. total 2011-2019 (%) |
|
Bangladesh |
1,136 |
1,293 |
1,599 |
1,551 |
2,235 |
2,333 |
2,152 |
3,613 |
2,874 |
15.3 |
18,786 |
8.3 |
|
The Gambia |
36 |
41 |
26 |
36 |
13 |
-28 |
18 |
52 |
44 |
-46.4 |
238 |
0.1 |
|
Kiribati |
0 |
-2 |
1 |
3 |
-1 |
2 |
1 |
-1 |
-1 |
-17.8 |
1 |
0.0 |
|
Lesotho |
61 |
57 |
50 |
95 |
207 |
159 |
123 |
129 |
118 |
17.2 |
998 |
0.4 |
|
Malawi |
93 |
81 |
89 |
387 |
510 |
116 |
90 |
959 |
822 |
151.9 |
3,148 |
1.4 |
|
Mozambique |
3,559 |
5,629 |
6,175 |
4,902 |
3,867 |
3,093 |
2,293 |
2,703 |
2,212 |
-2.5 |
34,433 |
15.3 |
|
Rwanda |
119 |
255 |
258 |
459 |
380 |
342 |
356 |
382 |
354 |
21.3 |
2905 |
1.3 |
|
Sierra Leone |
950 |
722 |
430 |
375 |
252 |
138 |
129 |
218 |
368 |
-3.0 |
3582 |
1.6 |
|
Solomon Islands |
120 |
24 |
53 |
22 |
32 |
39 |
43 |
25 |
33 |
6.6 |
390 |
0.2 |
|
Tanzania |
1,229 |
1,800 |
2,087 |
1,416 |
1,561 |
864 |
938 |
972 |
991 |
1.2 |
11,857 |
5.3 |
|
Tuvalu |
0 |
1 |
0 |
0 |
0 |
0 |
0 |
0 |
0 |
-162.4 |
3 |
0.0 |
|
Uganda |
894 |
1,205 |
1,096 |
1,059 |
738 |
626 |
803 |
1,055 |
1,259 |
7.0 |
8,735 |
3.9 |
|
Vanuatu |
70 |
38 |
1 |
13 |
31 |
44 |
38 |
37 |
35 |
144.7 |
308 |
0.1 |
|
Zambia |
1,109 |
1,732 |
2,100 |
1,489 |
1,305 |
663 |
1,108 |
408 |
548 |
3.1 |
10,460 |
4.6 |
|
LDC TOTAL |
19,839 |
26,758 |
20,855 |
27,238 |
37,790 |
25,939 |
20,808 |
23,163 |
23,294 |
5.4 |
22,5685 |
100.0 |
Source: UNCTAD World Investment Report 2021
A breakdown of announced greenfield FDI inflows, as presented in Table 9, provides a clearer indication of the extent to which investment was channelled into developing new productive capacity in Commonwealth LDCs. Greenfield investments involve a company building its operations in a foreign country from the ground up, and may, for example, take the form of investments to construct production and processing facilities, build new distribution hubs and offices, or develop project sites (Balchin, 2020). They can be instrumental in enhancing productive capacity, transferring skills and technology, and creating jobs (Commonwealth Secretariat, 2021). Such investments thus have the potential to drive long-term structural economic transformation in Commonwealth LDCs and support their post-COVID economic recovery.
Four countries accounted for the bulk of announced greenfield FDI in Commonwealth LDCs between 2011 and 2019, with Mozambique, Bangladesh, Tanzania and Zambia attracting 84 per cent of cumulative inflows (Table 9). Among these countries, growth in greenfield investment was very strong in Bangladesh, rising at an average annual rate of 171 per cent over the period. This was outstripped by growth in announced inflows to The Gambia and Malawi, albeit off much smaller initial bases in 2011. A few other Commonwealth LDCs performed less well in attracting greenfield investment during the pre-pandemic IPoA period. Solomon Islands and Vanuatu registered dwindling greenfield FDI inflows, declining at an average annual rate of 100 per cent. Growth in these inflows was sluggish in both Lesotho and Mozambique.
Table 9 underlines the importance of greenfield investment as a source of new jobs in Commonwealth LDCs during the IPoA. Investments announced between 2011 and 2019 created nearly 50,000 jobs in Mozambique, more than 45,000 jobs in Bangladesh and close to 38,000 jobs in Zambia. Substantial numbers of new jobs were also created in Tanzania, Uganda and Rwanda, and to a lesser extent Sierra Leone.
Table 9: Announced greenfield FDI inflows to Commonwealth LDCs, value, average growth and jobs created, 2011-2019
|
|
Cumulative value of capital investment 2011-2019 (US$ million) |
Avg. annual growth 2011-2019 (%) |
Share of cum. inflows to Commonwealth LDCs 2011-2019 (%) |
Total number of jobs created 2011-2019 |
|
Mozambique |
38,620.6 |
1.2 |
36.2 |
49,909 |
|
Bangladesh |
26,362.0 |
171.1 |
24.7 |
45,228 |
|
Tanzania |
13,618.6 |
13.0 |
12.8 |
29,162 |
|
Zambia |
11,034.8 |
43.3 |
10.3 |
37,884 |
|
Rwanda |
6,362.2 |
67.6 |
6.0 |
20,120 |
|
Uganda |
4,567.9 |
42.1 |
4.3 |
25,686 |
|
Malawi |
2,118.5 |
194.4 |
2.0 |
3,241 |
|
Sierra Leone |
2,008.9 |
69.9 |
1.9 |
8,672 |
|
Lesotho |
1,131.8 |
2.6 |
1.1 |
4,818 |
|
The Gambia |
707.6 |
358.8 |
0.7 |
1,763 |
|
Solomon Islands |
95.6 |
-100.0 |
0.1 |
349 |
|
Vanuatu |
46.5 |
-100.0 |
0.0 |
313 |
Source: fDi Markets database from the Financial Times Ltd
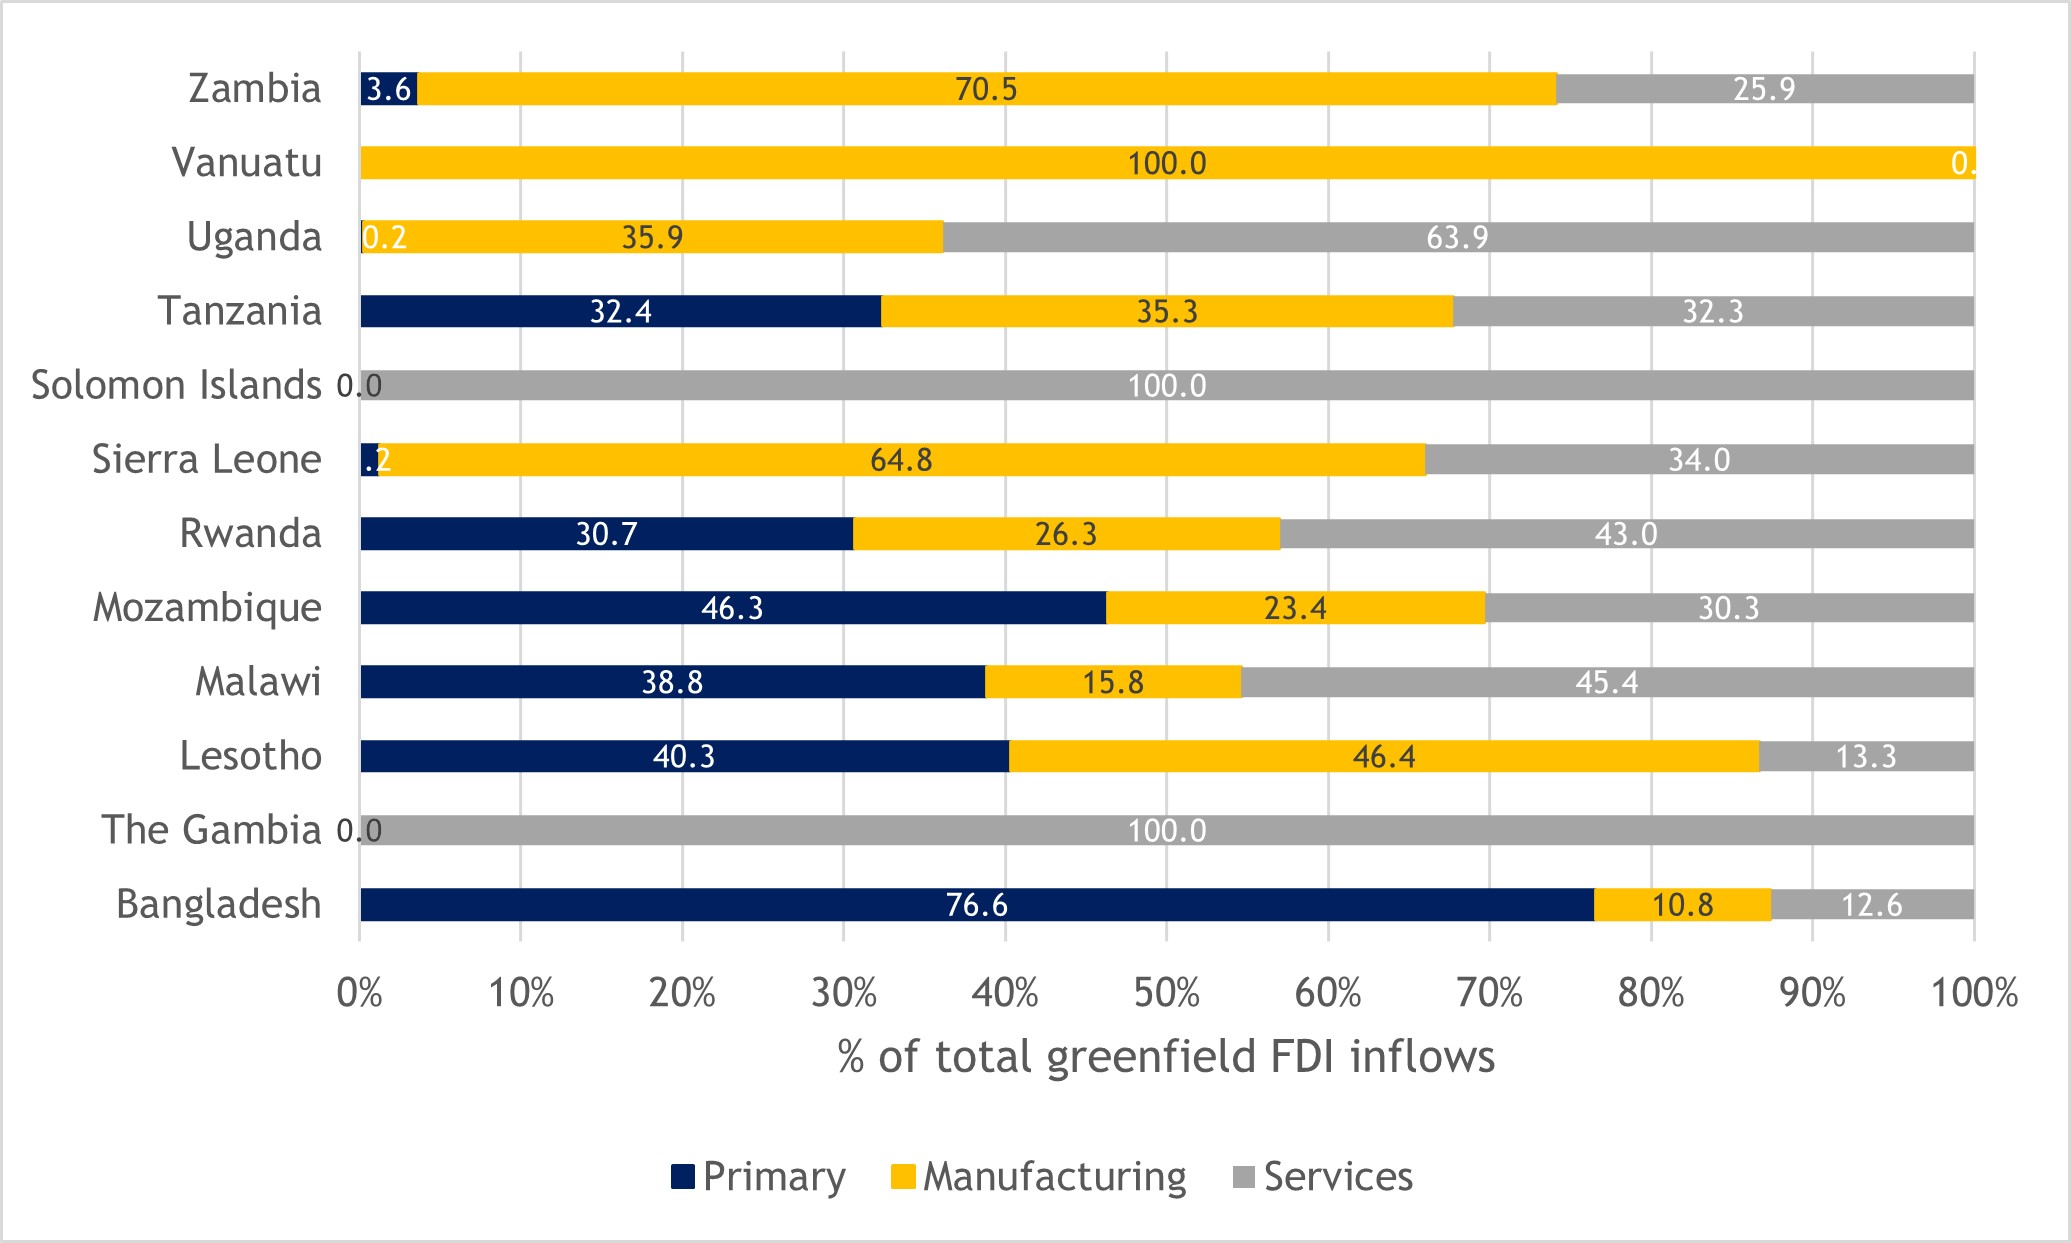
The sectoral distribution of greenfield investments announced in Commonwealth LDCs varied widely from country to country between 2011 and 2019. In Bangladesh and Mozambique, these investments were mostly concentrated in the primary sector, whereas manufacturing sectors absorbed the largest shares of greenfield inflows to Lesotho, Sierra Leone, Tanzania, Vanuatu and Zambia (Figure 30). The relatively high concentration of greenfield inflows in manufacturing in these countries is encouraging from the perspective of developing productive capacity. The services sector was the principal destination for greenfield investments in Malawi, Rwanda and Uganda during the course of the pre-pandemic IPoA years.
Figure 30: Broad sectoral distribution of greenfield FDI inflows to Commonwealth LDCs, based on cumulative values of capital investment 2011-2019 (%)
4.4 Aid inflows to Commonwealth LDCs
Faced with challenges mobilising domestic financial resources and, in some cases, difficulty attracting investment, many LDCs rely heavily on ODA to finance public expenditure. Recognising its importance, the IPoA sought to ensure better alignment of ODA and other forms of aid with LDCs’ national priorities (Schroderus-Fox, 2017). It also set a target for developed countries to provide between 0.15 and 0.20 per cent of GNI to LDCs (ibid.).
ODA continued to hold a prominent position in the fiscal landscape of LDCs throughout the IPoA. Across the overall LDC group, gross ODA disbursements accounted for 5.1 per cent of GDP and approximately 40 per cent of government expenditure in 2018 (UN-OHRLLS, 2020, 2021; ECOSOC, 2021a). Despite this, the portion of overall ODA allocated to the entire LDC group declined in relative terms during the course of the IPoA, falling from 33 per cent in 2011 to 31 per cent in 2018 (UN-OHRLLS, 2020). Over this period, the average share of GNI allocated as ODA to LDCs by Organisation for Economic Co-operation and Development (OECD) Development Assistance Committee (DAC) donors declined from 0.1 per cent to 0.09 per cent, thus falling well short of the IPoA target (ibid.). The decline occurred even prior to the onset of the COVID-19 pandemic, which has placed greater pressure on fiscal resources in donor countries and threatens to further constrain aid budgets.
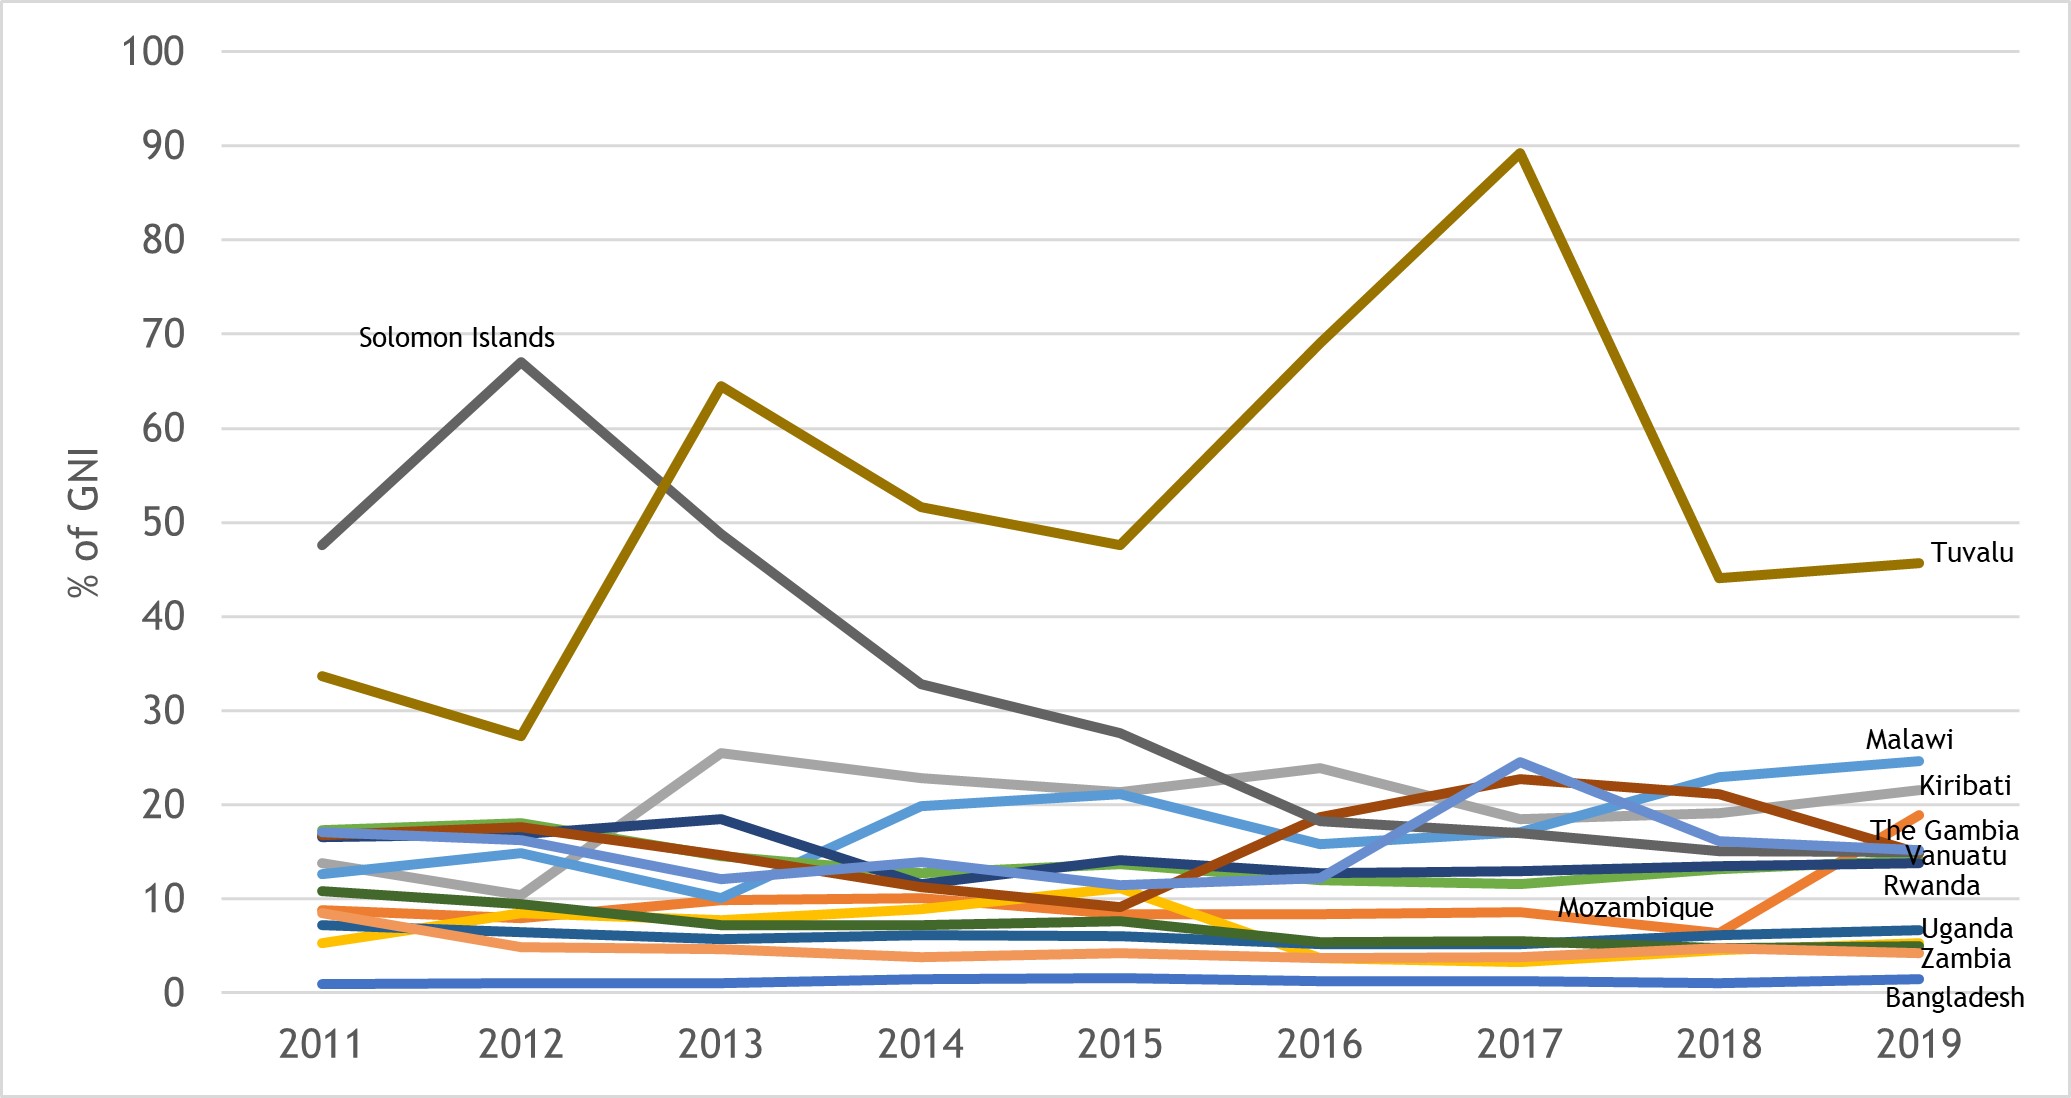
This general trend was evident in several Commonwealth LDCs during the IPoA. ODA received as a percentage of GNI followed a downward trajectory, albeit with some fluctuation between years, in eight of the 14 Commonwealth LDCs from 2011 to 2019 (Figure 31). Among the other six Commonwealth LDCs, the ratio of ODA to GNI was stable in Bangladesh and Lesotho across the pre-pandemic IPoA years, and increased for The Gambia, Kiribati, Malawi and Tuvalu. As of 2019, ODA received was equivalent to almost half of Tuvalu’s GNI, close to one-quarter of GNI in Malawi and more than one-fifth in Kiribati, which is indicative of the significant extent to which these countries rely on development assistance.
Figure 31: ODA received by Commonwealth countries, 2011-2019 (% of GNI)
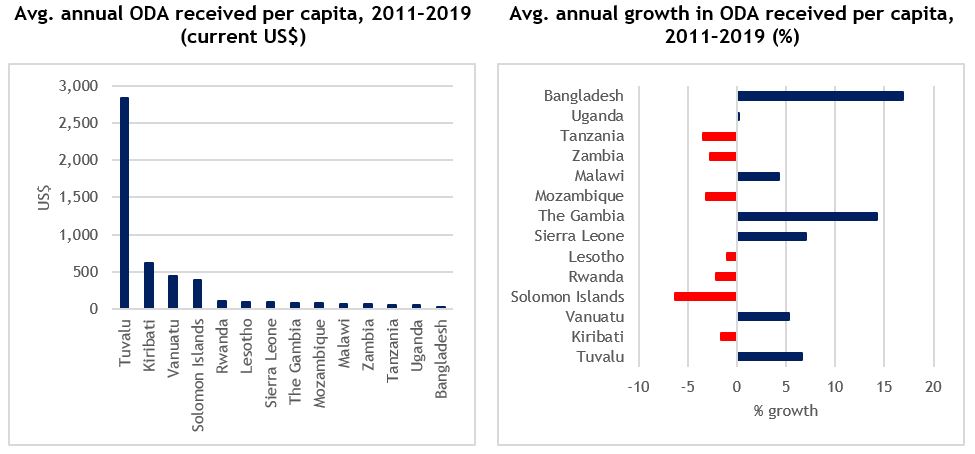
Levels of ODA per capita varied markedly during the IPoA period, and grew or declined at noticeably different rates, across the 14 Commonwealth LDCs. Kiribati, Lesotho, Mozambique, Rwanda, Solomon Islands, Tanzania, Tuvalu and Zambia all saw net ODA received per capita decline in 2019 compared with 2011 levels. Except for Tuvalu, average annual growth rates in ODA per capita were negative for each of these countries over the nine-year period (Figure 32), indicative of a sustained decline during the course of the IPoA. In contrast, ODA per capita in Bangladesh and The Gambia grew; it also expanded, albeit at slower rates, in Tuvalu and Vanuatu.
Commonwealth LDCs in the Pacific received the highest levels of ODA per capita, on average, during the pre-COVID years of IPoA implementation. Tuvalu topped the list by some margin, with net ODA per capita averaging US$2,843 from 2011 to 2019, followed by Kiribati ($612), Vanuatu ($447) and Solomon Islands ($392). Among the African LDCs, Rwanda, Lesotho and Sierra Leone benefited from the highest levels of ODA per capita; these were well short of their Pacific counterparts, averaging $98, $87 and $85, respectively. These levels were even lower in Uganda ($46) and Tanzania ($51). Apart from in Lesotho, Rwanda and Sierra Leone, average ODA per capita during 2011 to 2019 was lower in all other Commonwealth African LDCs (and Bangladesh) compared with the averages for non-Commonwealth LDCs ($84) and other developing countries ($160).
Figure 32: Net ODA received per capita by Commonwealth LDCs, 2011–2019, annual average (current US$) and annual average growth (%)
4.5 Remittances
Remittances represent a major source of financial inflows to LDCs. Remittance flows for the overall LDC group nearly doubled during the IPoA years preceding COVID-19, rising from US$28.2 billion in 2011 to $52.1 billion in 2019 (UN-OHRLLS, 2021). This was accompanied by a 1.6 percentage point increase in the share of global migrant remittance inflows going to LDCs, which stood at 7.4 per cent in 2019 (UN-OHRLLS, 2020).
Most Commonwealth LDCs registered growth in migrant remittance inflows between 2011 and 2019 (Table 10). Annual growth rates were strongest, on average, for inflows to Vanuatu and Malawi, where they exceeded 37 per cent. In turn, only Lesotho, Sierra Leone and Tuvalu recorded negative growth in inflows over the nine-year period. In absolute terms, Bangladesh attracted the largest migrant remittances by a considerable margin, with more than US$131.3 billion in cumulative inflows over the nine-year period at an average of $14.5 billion annually. This is a product of both Bangladesh’s large population and the country’s historical dependence on remittance earnings. Estimates suggest that close to 10 million migrant workers from Bangladesh work abroad, making the country one of the world’s top remittance earners (Bhuiyan, 2020).
Table 10: Migrant remittance inflows to Commonwealth LDCs, 2011–2019, value (US$ million) and average annual growth (%)
|
|
Cumulative inflows 2011-2019 (US$ million) |
Annual avg. inflows 2011-2019 (US$ million) |
Avg. annual growth rate, 2011-2019 (%) |
|
Bangladesh |
131,347 |
14,594 |
5.8 |
|
Uganda |
9,534 |
1,059 |
7.6 |
|
Lesotho |
4,473 |
497 |
-2.3 |
|
Tanzania |
3,611 |
401 |
0.8 |
|
Rwanda |
1,779 |
198 |
5.9 |
|
Mozambique |
1,701 |
189 |
21.7 |
|
The Gambia |
1,496 |
166 |
16.4 |
|
Malawi |
683 |
76 |
37.3 |
|
Zambia |
616 |
68 |
18.9 |
|
Sierra Leone |
514 |
57 |
-0.2 |
|
Vanuatu |
453 |
50 |
37.6 |
|
Solomon Islands |
175 |
19 |
6.8 |
|
Kiribati |
157 |
17 |
2.5 |
|
Tuvalu |
12 |
1 |
-13.8 |
|
CW LDC avg. |
11,182 |
1,242 |
5.7 |
|
Non-CW LDC avg. |
6,360 |
707 |
9.2 |
|
Developing country avg. (excl. LDCs) |
39,983 |
4,443 |
4.4 |
Source: Commonwealth Secretariat (calculated using World Bank World Development Indicators data)
Recognising the significant variation in population sizes across the 14 LDCs, Table 11 provides a measure of the magnitude of personal remittances received in Commonwealth LDCs relative to GDP, enabling a more meaningful cross-country comparison. This illustrates the extent to which personal remittances dominate the economic landscape in some Commonwealth LDCs. In 2019, these remittance inflows were equivalent to nearly one-quarter of GDP in Lesotho; in The Gambia they exceeded 15 per cent and in Tuvalu they amounted to close to 10 per cent. They were much lower in Sierra Leone, Solomon Islands, Malawi, Tanzania and Zambia (all equivalent to 1.3 per cent of GDP or less).
In most Commonwealth LDCs, average annual inflows of personal remittances remained fairly stable relative to GDP between the first (2011-2015) and second (2016-2019) halves of pre-pandemic IPoA implementation, with eight countries recording increases or decreases of less than 0.5 percentage points between the two periods. Only The Gambia and Vanuatu registered significant growth – of around 6 percentage points – in personal remittances in the latter half of the IPoA. The opposite was true for Lesotho, where average annual inflows of personal remittances declined by nearly 6 percentage points.
Table 11: Personal remittances received in Commonwealth LDCs, 2019 and annual averages 2011-15 vs. 2016-19 (% of GDP)
|
Country |
2019 |
Annual avg. 2011-2015 |
Annual avg. 2016-2019 |
|
Bangladesh |
5.4 |
9.8 |
7.0 |
|
The Gambia |
15.2 |
7.0 |
12.6 |
|
Kiribati |
9.6 |
9.7 |
9.0 |
|
Lesotho |
22.9 |
24.7 |
18.8 |
|
Malawi |
1.2 |
0.4 |
0.8 |
|
Mozambique |
2.0 |
1.0 |
1.1 |
|
Rwanda |
2.3 |
2.2 |
2.1 |
|
Sierra Leone |
1.3 |
1.7 |
1.2 |
|
Solomon Islands |
1.2 |
2.0 |
1.5 |
|
Tanzania |
0.8 |
0.8 |
0.8 |
|
Tuvalu |
10.0 |
12.6 |
10.8 |
|
Uganda |
3.8 |
3.1 |
3.3 |
|
Vanuatu |
3.0 |
2.4 |
8.6 |
|
Zambia |
0.4 |
0.2 |
0.2 |
|
CW LDC avg. |
5.6 |
5.6 |
5.6 |
|
Non-CW LDC avg. |
6.3 |
5.5 |
6.3 |
|
Developing country avg. (excl. LDCs) |
5.6 |
5.3 |
5.4 |
Source: Commonwealth Secretariat (calculated using World Bank World Development Indicators data)
On balance, Commonwealth LDCs continued to receive sizeable inflows of remittances during the first nine years of IPoA implementation. In most LDCs, such inflows have historically been directed towards current household consumption rather than going towards financing investment in productive activities (UNCTAD, 2021c). There would thus appear to be considerable scope to channel a greater share of the sizeable remittance inflows towards productive investments in Commonwealth, and other, LDCs.
4.6 Outstanding issues not addressed (or not fully addressed) under IPoA
The analysis in this chapter presents a mixed picture of financial resource mobilisation in Commonwealth LDCs across the pre-pandemic IPoA years. Eight Commonwealth LDCs managed to expand their tax revenue collections relative to GDP in the second half of the pre-pandemic IPoA period, and Bangladesh and Solomon Islands had reduced their ratios of external debt stocks to GNI by 2019. These two countries, along with Malawi and Vanuatu, also managed to increase the size of their total reserves relative to external debt. Most Commonwealth LDCs continued to attract FDI, and growth in greenfield investment was especially strong in Bangladesh, Malawi and The Gambia. Alongside Tuvalu and Vanuatu, Bangladesh and The Gambia also registered growth in ODA per capita. In turn, migrant remittances expanded in most Commonwealth LDCs (especially Malawi and Vanuatu), and personal remittances continued to dominate the economic landscape in some of these countries.
Yet ability to generate own domestic revenue remains limited in many Commonwealth LDCs, given their persistently narrow fiscal bases and weak tax administration capacity. In addition, rising external debt stocks during the IPoA years, coupled with dwindling reserves, mean several Commonwealth LDCs remain at risk of debt distress. Mozambique, Rwanda, Tanzania, Uganda and Zambia faced rapidly expanding debt service burdens throughout the IPoA, and the cost of servicing external debt increased in all but one (Solomon Islands) of the Commonwealth LDCs. Investment inflows were also sluggish: in most Commonwealth LDCs, net FDI inflows, when measured as a percentage of GDP, generally followed a downward trajectory, and these inflows were volatile and distributed unevenly across the 14 countries. With limited policy space to address these challenges, Commonwealth LDCs continued to rely heavily on ODA, even as ODA received as a percentage of GNI followed a downward trajectory in more than half of the 14 countries and net ODA received per capita was lower in 2019 compared with 2011 in Kiribati, Lesotho, Mozambique, Rwanda, Solomon Islands, Tanzania, Tuvalu and Zambia.
As a result of these difficulties, financing and investment in most Commonwealth LDCs continues to fall significantly short of the levels required to support sustained economic growth, develop productive capacity and drive economic transformation. UNCTAD (2021c) estimates that investment in LDCs will need to grow at a rate of 7 per cent per annum to achieve the original IPoA growth target, and even larger growth rates – of 9 and 20 per cent – will be necessary to end extreme poverty (SDG 1.1) and double the share of manufacturing in GDP (SDG 9.2), respectively. Across the entire LDC group, this translates into additional financing needs of US$462 billion to meet the growth target, $485 billion to eradicate extreme poverty and $1,051 billion to double the share of manufacturing in GDP over the period from 2021 to 2030 (UNCTAD, 2021c). UNCTAD’s estimates suggest additional financing for LDCs – equivalent to around 18 per cent of GDP – is also required to achieve the goals of universal social protection, healthcare and education (ibid.). Practical and innovative measures are needed to address these financing and investment gaps if Commonwealth LDCs, and indeed the entire LDC group, are to accelerate their development over the next decade.
[1] Based on the average tax revenue-to-GDP ratios for the period 2011-2016; latest available data for Bangladesh.
[2] The share of global FDI inflows directed to LDCs stood at 1.8 per cent in 2018.