By Brendan Vickers, Economic Adviser and Head, International Trade Policy Section; Salamat Ali, Economic Adviser & Trade Economist and Neil Balchin, Economic Adviser, Trade Policy Analysis, The Commonwealth Secretariat
In 2020, the share of Least Developed Countries (LDCs) in world trade remained at just 1%. Although the Istanbul Programme of Action (IPoA) for LDCs and SDG target 17.11 both sought to double LDCs’ share of global exports by 2020, the world’s 47 LDCs missed the target. While this could be regarded as a “lost decade” for gains from trade, the performance of the Commonwealth’s 14 LDCs tells a more promising story: their collective share in global exports was 1.27 times higher in 2020 than in 2011 and two LDCs — Rwanda and Tuvalu — almost doubled their share of world exports.
What has driven export growth in Commonwealth LDCs?
Four factors would seem to underpin the trade performance of Commonwealth LDCs:
Faster economic growth
Before the COVID-19 pandemic outbreak, Commonwealth LDCs’ GDP grew at an average annual rate of 5.5% between 2011 and 2019, compared to an average global growth rate of just 2.2% and 4.2% for all 47 LDCs combined.
Higher GDP growth rates in Commonwealth LDCs were accompanied by larger trade volumes. Collectively, global goods and services exports by all 47 LDCs rose from USD 215 billion in 2011 to just over USD 241 billion in 2019, an increase of around 12%. The corresponding increase for the Commonwealth LDCs was 41%. Their exports grew from USD 57 billion to about USD 80 billion at an average rate of 3.7% per annum, compared with just 0.6% for the 47 LDCs and 1.2% across the world.
A major boost from intra-Commonwealth trade
Commonwealth LDCs relied heavily on intra-Commonwealth trade during this period, which grew significantly despite the 54-member body not being a trading bloc. In 2019, the Commonwealth absorbed one quarter (USD 19 billion) of their total goods and services exports (USD 79 billion). During the pre-pandemic years (2011-2019), the share of Commonwealth LDCs in intra-Commonwealth goods exports climbed from 2.18% to 3.4%. Over the same period, the share of LDCs in world trade stagnated at 1% (Figure 1).
Figure 1: LDCs’ share in global and intra-Commonwealth merchandise exports, 2011 vs. 2019

Note: The chart compares LDCs’ share in global and intra-Commonwealth merchandise exports in 2011 and 2019.
Source: Commonwealth Secretariat (calculated from UNCTADstat and OECD-WTO BaTIS data)
A significant and growing “Commonwealth advantage” in trade has driven this increase in exports, helping to build, strengthen and sustain trading relationships between Commonwealth LDCs and other member countries. Historical ties, familiar legal and administrative systems, the widespread use of English and the presence of large and dynamic diasporas, mean bilateral trade costs are around 21% lower, on average, for Commonwealth country pairs compared with the cost of trading with non-Commonwealth countries.
Bangladesh’s strong export performance
Bangladesh, the largest Commonwealth LDC, contributed significantly to this group’s overall trade performance (Figure 2, Panel A). Bangladesh’s global exports increased by almost 65%, from USD 27 billion in 2011 to more than USD 45 billion in 2019. Despite this large increase, Bangladesh still fell short of the IPOA target, although it came closest in the case of services exports, where the sector’s share was 1.83 times higher in 2019 compared to 2011.
Figure 2: LDC exports of goods and services (USD billion), 2011-2020
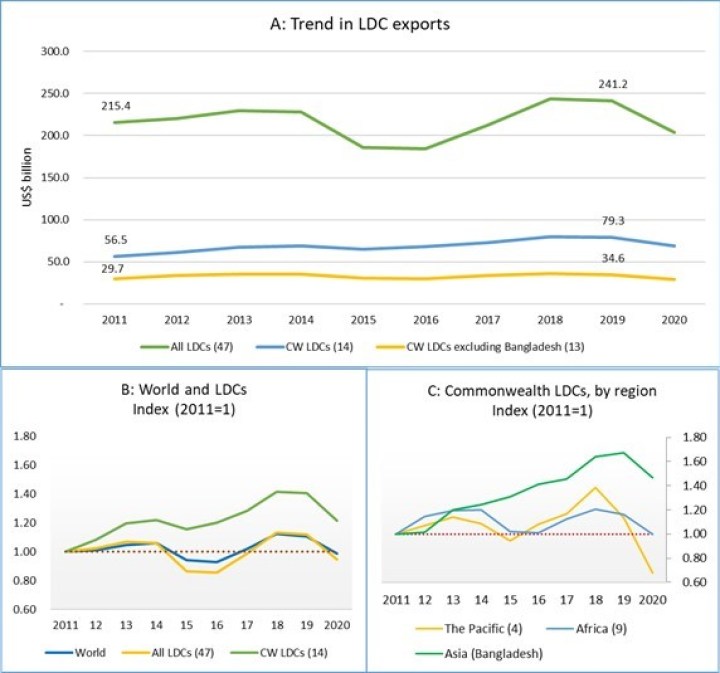
Source: Commonwealth Secretariat using UNCTADstat
Exports from the Commonwealth’s nine African LDCs increased marginally between 2011 and 2020, from USD 29 billion to USD 34 billion, while those from Pacific members grew by a mere USD 120 million. By the end of 2019, Bangladesh’s share in world trade was 1.5 times higher while it remained largely unchanged for African members and grew marginally (1.15 times higher) for the four Commonwealth LDCs in the Pacific. In absolute terms, exports from Tuvalu almost doubled in value.
Diversified exports – both merchandise and services were drivers of export growth
Commonwealth LDCs’ export growth was driven by both the merchandise and services sectors, although not in equal measure. For the two LDCs – Rwanda and Tuvalu – that were closest to achieving the IPoA trade targets, growth in trade was driven by merchandise and services, respectively. Overall, Commonwealth LDCs’ service exports grew faster than their merchandise exports, increasing by USD 7.5 billion – from USD 9 billion in 2011 to around USD 17 billion in 2019. The cumulative growth in the value of their services exports in this period amounted to 85%, almost three times greater than the growth in their merchandise exports (32%). Despite the improved performance of services exports during the pre-pandemic period, Commonwealth LDCs still rely heavily on merchandise trade, which accounts for 80% of their exports.
COVID-19 shocks and their reverberations
Unfortunately, the COVID-19 pandemic has reversed most of these trade gains (Figure 3). The services sector was hit particularly hard: in 2020, services exports from Commonwealth LDCs contracted by 27% and merchandise exports shrank by 10%. While Rwanda and Bangladesh maintained their shares of global exports at 2019 levels, these shares declined for five African members: The Gambia, Lesotho, Malawi, Sierra Leone and Tanzania. Zambia was the only Commonwealth LDC whose share of global exports increased slightly in 2020, mainly due to rising demand for copper in the transport (electric vehicles), renewable energy and manufacturing sectors. While Zambia’s services exports declined in 2020, the country’s merchandise exports expanded by USD 1 billion (from USD 7 billion in 2019). Even so, Zambia’s share in global exports in 2020 was still below the level in 2011 at the start of the IPoA.
Figure 3: Changes in Commonwealth LDCs’ share of global exports during 2011-2020, by country (Index 2011=1)

Note: The chart presents changes in total goods and services exports shares during 2011-2019 and 2011-2020. The dotted lines indicate the average change for all Commonwealth LDCs.
Source: Commonwealth Secretariat using UNCTADstat
LDCs in global trade: Much work to be done
Although Commonwealth LDCs’ export growth was higher than that for all 47 LDCs, they missed the target of doubling their share of global exports by the end of the IPoA. Given the strong linkages between trade and the SDGs, and the important role of trade in building back better from the pandemic, there is a pragmatic imperative to raise the share of LDCs in world trade to restore progress towards the SDGs. LDCs need assistance to accelerate economic transformation, build production and trading capacity, close digital divides and participate effectively in the multilateral trading system. They also require improved access to finance and help to ensure greater debt sustainability. These issues should be at the core of discussions at the Fifth UN Conference on the Least Developed Countries later in 2022.
This article was originally published by OECD Development Matters