
Commonwealth Pacific
5.1 Overview of agriculture in Commonwealth countries in the Pacific
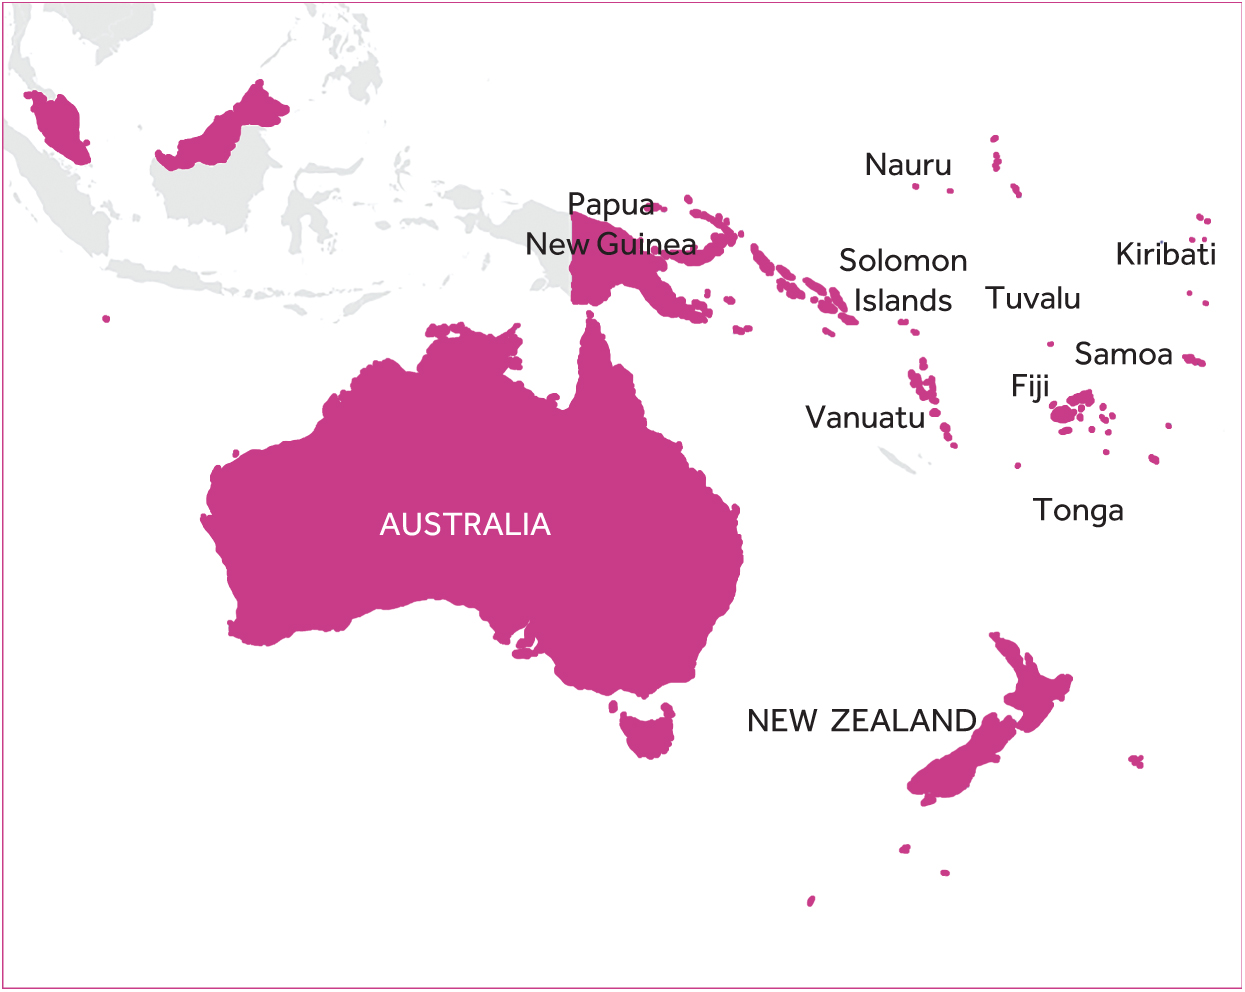
Eleven countries in the Pacific are members of the Commonwealth. For the purpose of this study, these have been split into two categories: (1) Small Island Developing Countries (SIDS), herein referred to as Pacific SIDS, and (2) Australia and New Zealand.
5.1.1 Small island developing states (SIDS)
SIDS are a group of developing countries, mostly comprised of small islands, which tend to share similar sustainable development challenges. Except for Australia and New Zealand, all the Pacific countries that are members of the Commonwealth are classified as Pacific SIDS in this study. These countries include Fiji, Kiribati, Nauru, Papua New Guinea, Samoa, Solomon Islands, Tonga, Tuvalu and Vanuatu.
Just like is the case with the Caribbean countries, the Pacific SIDS are characterised by remoteness, poor infrastructure, vulnerability to external shocks, dependence on imported food, small size, limited resources and isolation from markets. In the Pacific SIDs, traditional farming systems characterised by customary practices and societal norms in the production of crops are predominant. Some of the major food production systems in the Pacific SIDS differ across countries are shown in Table 5.1 as shown below.
Table 5.1: Some major food production systems across Pacific SIDS
|
Island types |
Food production systems |
|
High (volcanic) islands (large and middle size)
|
*Increasing reliance on imported rice and wheat Increase in energy-dense, nutrient-poor, cheap imported foods |
|
Low islands (mainly coral atolls)
|
* There is currently no formal commercial farming in Nauru |
5.1.2 Australia and New Zealand
Despite the close geographical proximity to the Pacific SIDS, Australia and New Zealand differ significantly. First, both nations have per capita gross national incomes higher than $12,536. Per the World Bank classification, this makes them high-income countries. Second, the structure of agriculture in these two countries is different from the structure in the Pacific SIDS as discussed below.
Agriculture in both New Zealand and Australia is characterised by the presence of few farms, but of very large sizes. Average farm sizes are shown below.
- Australia – 10,702 acres (4,331 hectares)
- New Zealand – 667 acres (270 hectares)
Operating at a large scale presents several scale advantages:
- Large farms can leverage scale technologies, for example GPS-equipped smart farming technologies that allow for the reduction of the amounts of applied inputs and other smart farming technologies such as GPS-assisted tractors, drones, satellite images as these are mostly viable on large-scale and monoculture farming. Technological advancements have had a significant impact on farm operations, shifting the agricultural industry to a much more capital-intensive model and resulting in larger farms and increased productivity.
- Operators of larger farms also have better access to information, because of higher human and financial capacity. Similarly, larger agri-food firms generally have more capacity to carry out innovation activities, acquire technology, deal with regulations, and access export markets.
5.2 Systemic constraints to agriculture in the Pacific SIDS
5.2.1 Climate vulnerability and agricultural productivity
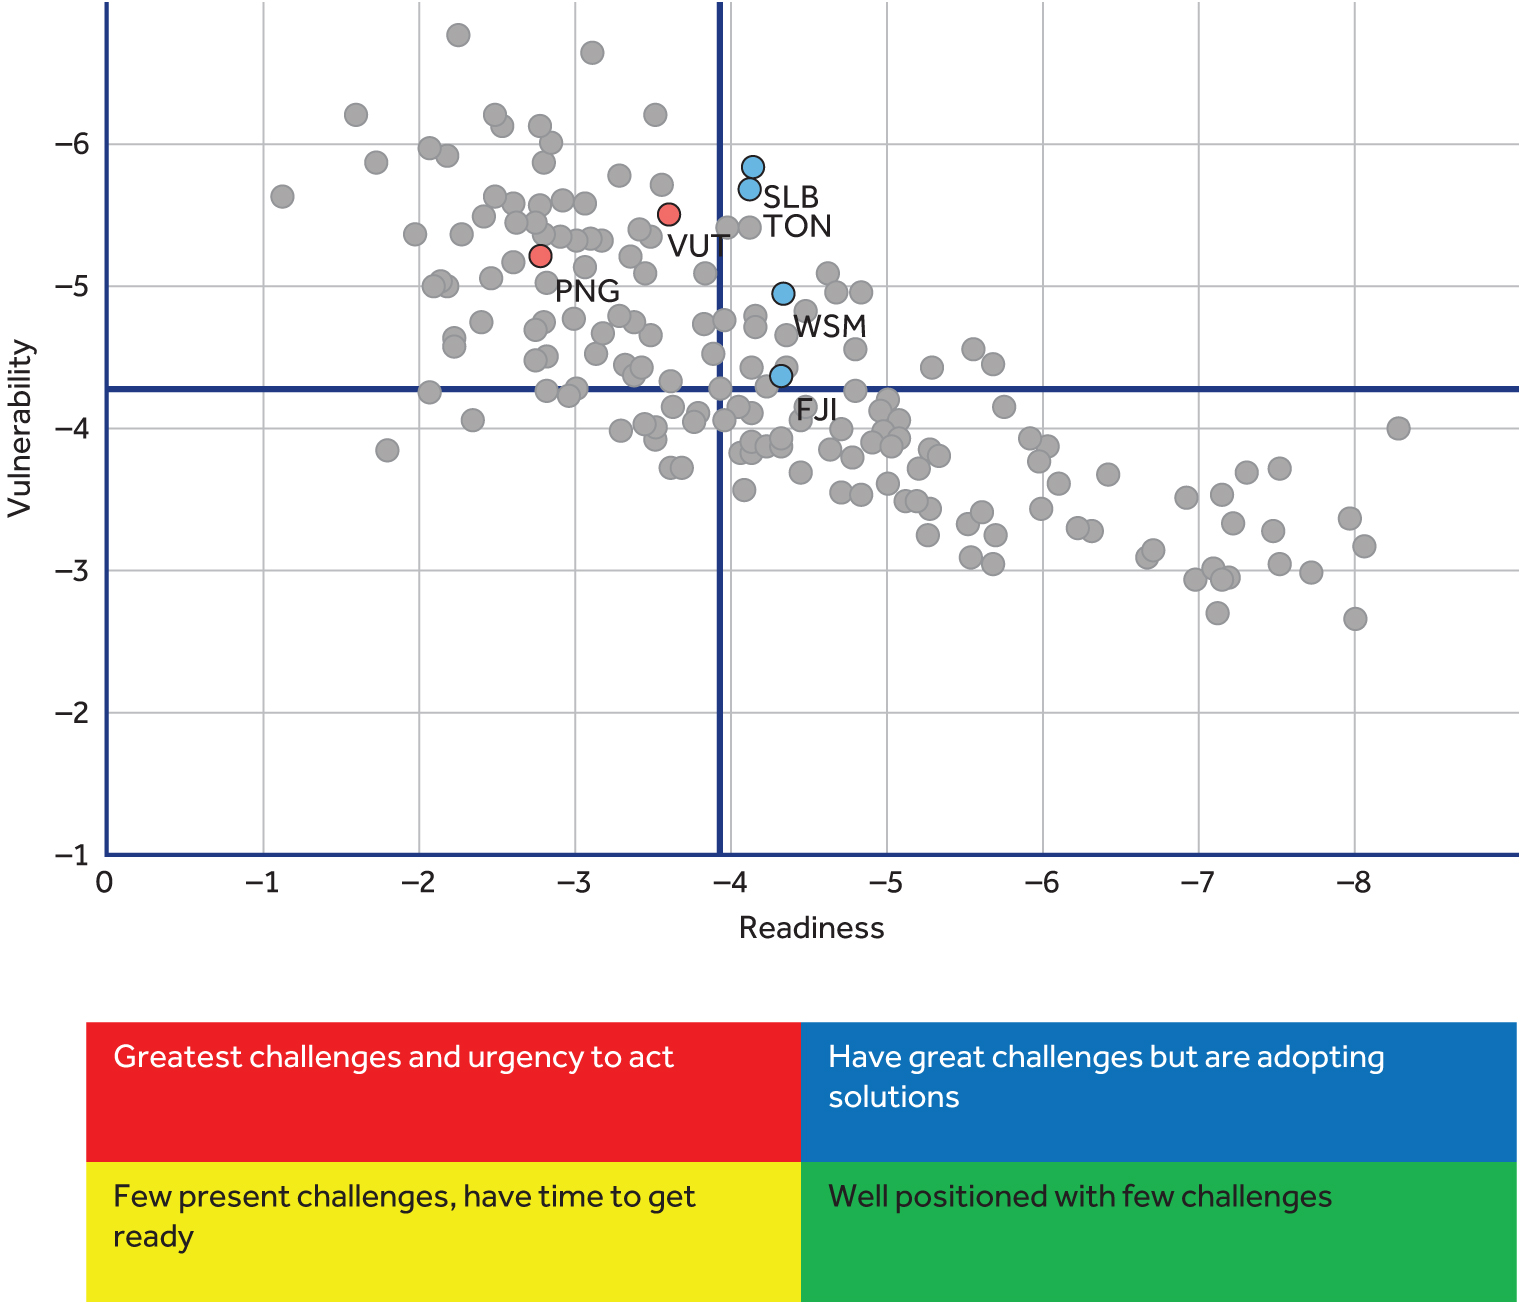
To show the level of vulnerability to climate shocks and readiness to respond to these shocks, the ND-GAIN Matrix is used. The matrix provides a visual tool for quickly comparing the current state of climate vulnerability and readiness of different countries.[1]
Source: University of Notre Dame Global Adaptation Index.[2]
There are two categories of countries in the Pacific SIDS. Those in the red zone and those in the blue zone. Those in the red zone have a high level of vulnerability to climate change but a low level of readiness. These countries have both a great need for investment to improve readiness and a great urgency for adaptation action. Those in the blue zone have a high level of vulnerability to climate change and a high level of readiness. In these countries, the need for adaptation is large, but they are ready to respond. The private sector may be more likely to participate in the adaptation here than in countries with lower readiness.
Table 5.2: The predominant climate-related phenomena in the region
|
Climate change phenomenon |
Impact on the agriculture sector |
|
Increasing air temperatures |
|
|
Changing rainfall patterns |
|
|
Accelerated sea-level rises |
|
|
Changing ocean salinity and acidity |
|
Climate vulnerability in the region has and will continue to have an effect on the productivity of crops grown as shown in the following slide.
Table 5.3: Potential impact of climate change on the agriculture sector (food systems) in Pacific SIDS
|
Crop or livestock |
Short term (2030) |
Medium term (2050) |
Long term (2090) |
||||
|
Staple food crops |
|||||||
|
Sweet potato |
Moderate |
Moderate |
Moderate to high |
||||
|
Cassava |
Insignificant to low |
Low to moderate |
Low to moderate |
||||
|
Taro |
Low to moderate |
Moderate to high |
High |
||||
|
Cocoyam |
Insignificant to low |
Low |
Low to moderate |
||||
|
Swamp taro |
Moderate to high |
High |
High |
||||
|
Giant taro |
Insignificant to low |
Low |
Low |
||||
|
Domesticated yams |
Moderate to high |
High |
High |
||||
|
Wild yams |
Insignificant to low |
Low |
Low |
||||
|
Breadfruit |
Insignificant to low |
Low to moderate |
Low to moderate |
||||
|
Rice |
Moderate to high |
High |
High |
||||
|
Banana |
Low |
Low to moderate |
Low to moderate |
||||
|
Bele (aibika |
Low |
Low to moderate |
Low to moderate |
||||
|
Export commodities |
|||||||
|
Coconut |
Low |
Low to moderate |
Low to moderate |
||||
|
Coffee |
Moderate |
High |
High |
||||
|
Cocoa |
Low |
Moderate |
Moderate to high |
||||
|
Oil palm |
Insignificant |
Low |
Low |
||||
|
Sugar |
Low |
Low to moderate |
Moderate |
||||
|
Crop or livestock |
Short term (203) |
Medium term (2050) |
Long term (2090) |
|
|||
|
High-value horticulture crops |
|
||||||
|
Papaya |
Low to moderate |
Moderate to high |
High |
|
|||
|
Mango |
Low to moderate |
Moderate |
Moderate to high |
|
|||
|
Citrus |
Insignificant to low |
Low |
Low |
|
|||
|
Pineapple |
Insignificant |
Low to moderate |
Low to moderate |
|
|||
|
Watermelon |
Low to moderate |
Low to moderate |
Moderate |
|
|||
|
Tomato |
Moderate |
Moderate to high |
Moderate to high |
|
|||
|
Vanilla |
Insignificant |
Low to moderate |
Low to moderate |
|
|||
|
Ginger |
Insignificant to low |
Low to moderate |
Low to moderate |
|
|||
|
Kava |
Low |
Moderate |
Moderate |
|
|||
|
Betel nut |
Insignificant to low |
Low |
Low |
|
|||
|
Livestock |
|
||||||
|
Cattle |
Low |
Moderate |
Moderate to high |
|
|||
|
Pigs |
Low |
Moderate |
Moderate |
|
|||
|
Poultry |
Moderate |
High |
High |
|
|||
Use of index-based insurance in Pacific Island Commonwealth Countries
The predominantly small size and the diverse nature of their agricultural production systems make investments unattractive to private insurers. Nevertheless, Government-led initiatives in the region to ensure smallholder farmers have been in existence. A case in point is the Catastrophe Risk Insurance Pilot Programme.
Catastrophe risk insurance can provide quick pay-outs in the wake of a major disaster. The Pacific Catastrophe Risk Insurance Pilot tested a multi-country index-based risk pooling programme. It was established by Marshall Islands, Samoa, Tonga, and Vanuatu to increase their financial resilience against natural disasters, like tropical cyclones, earthquakes and tsunamis. The World Bank acted as an intermediary between those countries and a group of re-insurance companies. Pay-outs are triggered by specific physical parameters for the disasters (e.g. wind speed and earthquake ground motion) taken from the Joint Typhoon Warning Centre and the US Geological Services (USGS).[3]
5.2.2 Access to finance and investment
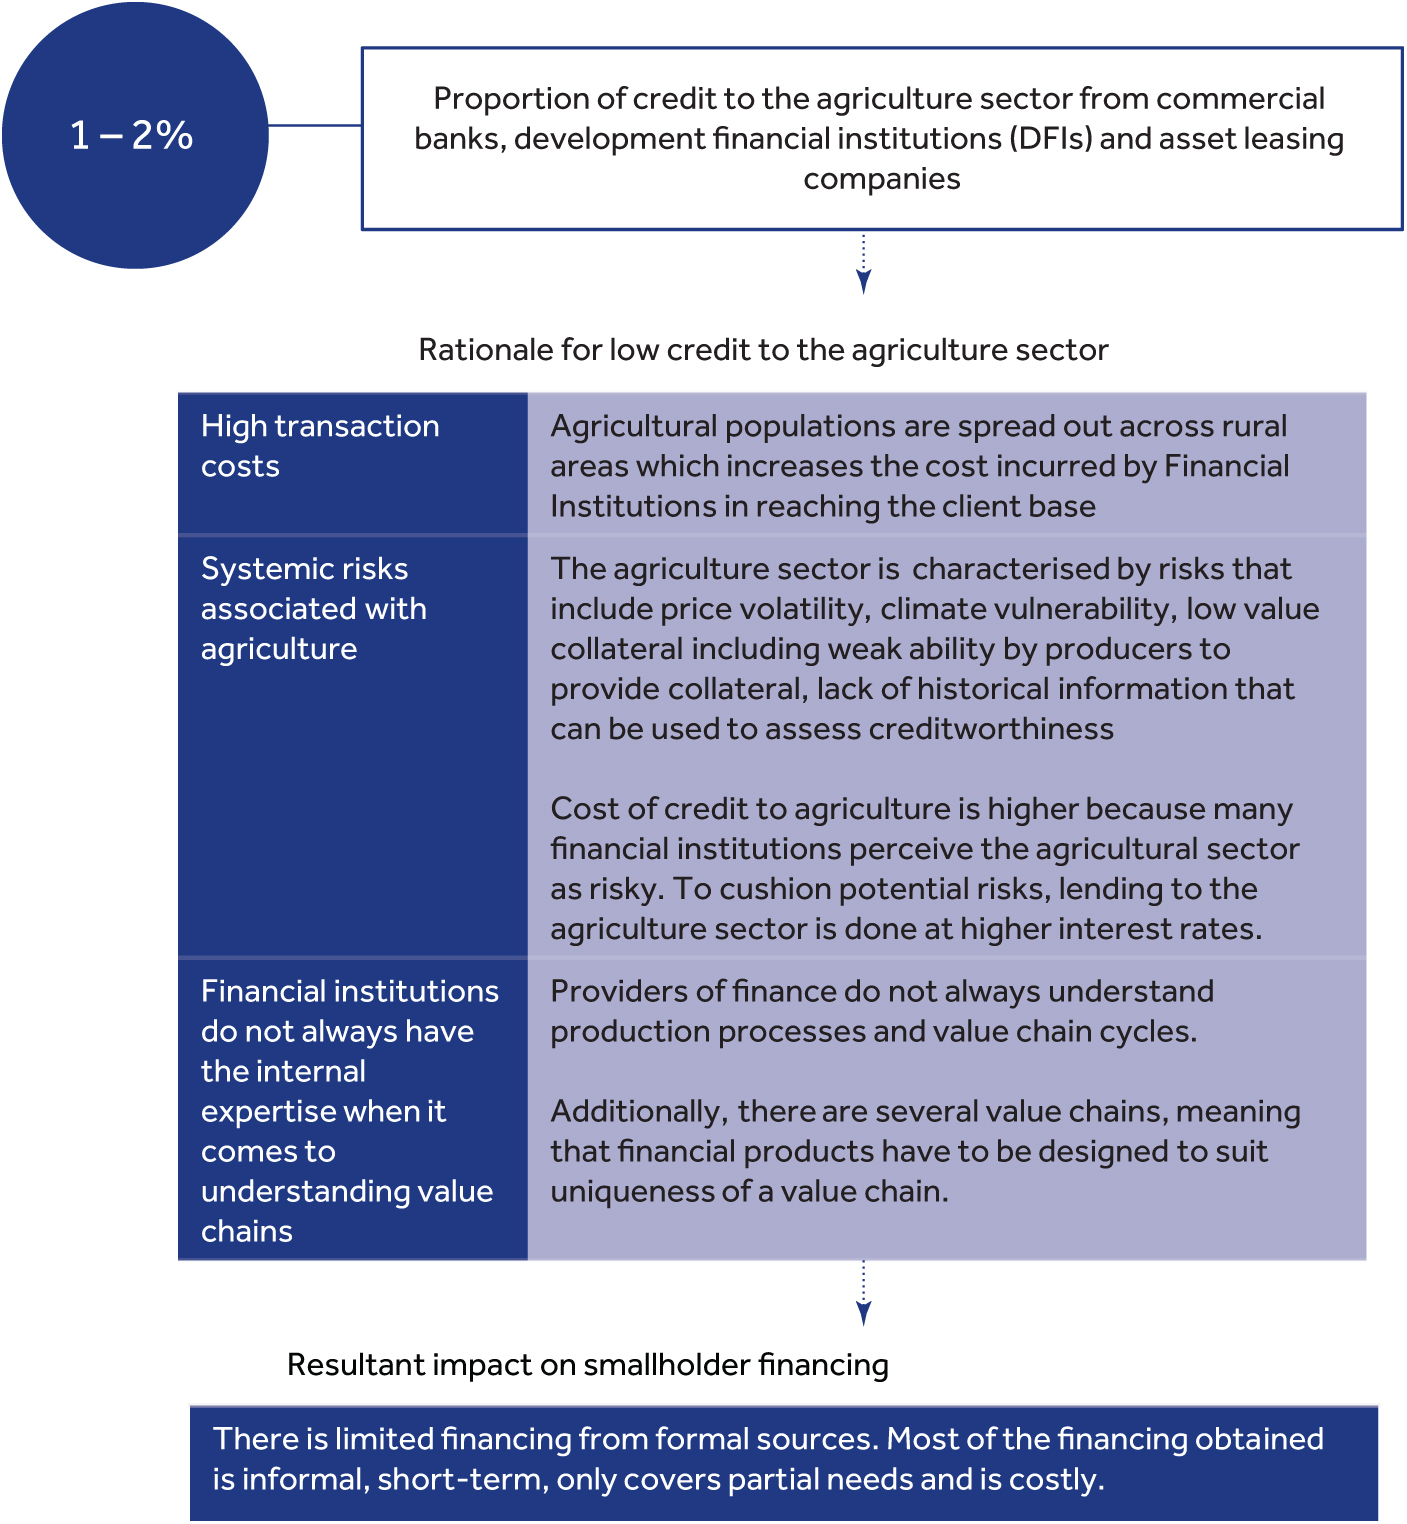
The agriculture sector in the Pacific SIDS is grossly under-funded. Lending to the agriculture sector from commercial banks and asset leasing companies, in six of the nine Commonwealth Pacific SIDS (Fiji, Kiribati, Samoa, Solomon Islands, Tonga and Vanuatu, is between 1 and 2 per cent. The overall lending to the agriculture sector is low even though the agriculture, forestry, and fishing, value added ( per cent of GDP) is 17 per cent and the sector employs 36 per cent of the population in six of the nine Commonwealth Pacific SIDS.[4]
The low financing to the agriculture sector is mostly due to the challenges that come with financing the sector as opposed to the lack of financing institutions. In fact, there are several licensed commercial banks – both foreign (eight) and national (four that provide financing to the agricultural sector. These include the Australia and New Zealand Banking Group (present in seven Commonwealth Pacific SIDS), Bank of South Pacific (present in five Commonwealth Pacific SIDS) and Bred Bank (present in three Commonwealth Pacific SIDS).
5.2.3 Market, trade and supply chain
The agriculture sector is not organised or demand driven. It is based on seasonality as opposed to consumer demands. This is propelling high dependency on imported foods because sectors like tourism need to have a steady and secure food supply. Caribbean and Pacific SIDS import over 60 per cent of their food; half of them import over 80 per cent.[5]High dependency on imported foods has resulted in a high capital flight from the region. High import dependency is also driven by the following:
- Imported foods tend to be cheaper than local options.
- Local production cycles are not organised. There is limited collective action in production and marketing. Farmers find to prefer to find their own markets as opposed to practicing contract farming.
Just like in the Caribbean SIDS, the small size and geographic isolation of the Pacific SIDS pose challenges in transport and trade logistics. The Liner Shipping Connectivity Index (LSCI) is used to assess trade facilitation for SIDS. The LSCI aims at capturing the level of integration into the existing liner shipping network. The LSCI can be considered an accessibility proxy to global trade.
Table 5.4: The Liner Shipping Connectivity Index
|
The Liner Shipping Connectivity Index (captures the level of integration into the existing liner shipping network by measuring liner shipping connectivity) |
|
|
Pacific SIDS |
|
|
Fiji |
9 |
|
Kiribati |
5 |
|
Nauru |
N.A |
|
Papua New Guinea |
11 |
|
Samoa |
8 |
|
Solomon Islands |
9 |
|
Tonga |
7 |
|
Tuvalu |
2 |
|
Vanuatu |
7 |
Source: UNCTAD maritime connectivity indicators.[6]
5.2.4 Gender mainstreaming
Men mostly engage in more lucrative cash crop production while women mostly engage in subsistence food production. Subsistence production in which women engage typically entails planting, tending, and harvesting crops for home consumption. This is typically considered a part of their household duties. Additionally, noteworthy is the fact that, just as is the case in rural Asia, Africa and the Caribbean islands, women in the Pacific SIDS balance agricultural activities with household domestic work. It may also be expected of women to provide unpaid labour on cash crop farms for their husbands and fathers.
Women have less access to critical agriculture production assets and support functions such as agricultural land, credit, markets, training and infrastructural support as compared to men. Additionally, women in rural areas are usually the last to benefit from gender mainstreaming programmes because of remoteness. Development organisations tend to be closer to towns and urban locations than remote ones.
5.2.5 Youth employment and entrepreneurship
Youth involvement in agriculture is still lacking in most of the Pacific SIDS despite the significant youth unemployment in the region. The agricultural sector however provides some opportunities for job creation to take up the unemployed youths.
With over half of the SIDS population is categorised as youths aged 25 years or younger, the majority are migrating to urban areas in search of better employment opportunities.
In a bid to increase youth employment in the SIDS, in 2010, the Pacific Youth in Agriculture Strategy 2011–15 was developed by the Secretariat of the Pacific Community and endorsed by the ministers. The strategy fronts the following key pillars:
- engaging youths as partners,
- provision of youth-specific services to support them as agricultural entrepreneurs,
- ensuring market access for agricultural produce,
- promotion of agriculture as a profession for youths,
- coordinating technical and financial assistance,
- ensuring evidence-based research,
- building systems of accountability and,
- ensuring community-based approaches to youth involvement at village level.
Case study: Impact of the COVID-19 pandemic on the agriculture sector in Commonwealth Pacific
Impact of the COVID-19 Pandemic
Pacific SIDS
Below is a summary of the impacts of the pandemic in the SIDS[7]:
- Movement restrictions affected smallholder farmers and fishermen on the islands.
- Input supply shortages due to lockdown restrictions.
- Reduced demand for agro-exports especially for large Islands such as Solomon Islands, Vanuatu and Fiji.
- Shutdown of the tourism sector negatively impacted farmer incomes for products such as coconuts.
Australia and New Zealand
- Reduced demand: Following the closure of restaurants, the demand for agricultural produce crumbled. For example, in Australia, the demand for avocados fell by 30 per cent following lockdown restrictions.[8]
- Hampered Exports: The general slowdown of global freight negatively impacted seafood exports for farmers especially in Australia. Inability to export products to the global market resulted in flooding of domestic markets which resulted in price falls.[9]
- Hinderance of Input supply: Disruptions in the global supply chain resulted in a shortage of agricultural inputs for farmers.
- New Zealand's agricultural sector fared in the midst of the pandemic. This was partially due to the sustained demand for New Zealand’s food exports such as dairy, meat and fruits, on the international market.
Responses in light of COVID-19 outbreak
Pacific SIDS
Government stimulus packages
- Following lockdown measures, there was an upsurge in the demand for planting materials, seeds and gardening equipment. In islands such as Fiji, the Government distributed 11,602 seedling packages to citizens, focusing on corporate employees that were laid off following the outbreak.
Australia and New Zealand
Essential worker exemptions in Australia[10]
- Farmers and agribusiness workers coming from COVID-19 hotspots in Australia were given an option to apply for a specialist/essential worker status that would enable them to cross interstate lines.
- Seasonal workers were issued border permits to grant entry into Australia for the harvest season.
- The Australian Agricultural Workers Code was signed into the public health orders to enable primary industries to source unskilled labour for the harvest season.
JobKeeper payment[11]
- JobKeeper payments were extended to aid businesses affected by the outbreak. These were payments that the Australian Government paid to eligible businesses to help offset the costs of wages. These payments amounted to $1,500 (before tax) per fortnight per employee retained during the pandemic. This ensured that agribusinesses were in a position to retain and pay the necessary workforce during the pandemic.
5.3 State of digital agriculture in the Pacific SIDS
5.3.1 Digital innovations in the Pacific
An exhaustive listing of all digital agriculture solutions in the region remains largely unavailable in the existing literature. The following four digital agriculture solutions were purposively sampled:
- Farmis in Papa New Guinea;
- TraSeable farms from Fiji;
- Kamapim PNG in Papua New Guinea; and
- Maua mobile application in the Samoa.
All four assessed digital agriculture solutions were developed by private entities.
Digital agriculture solutions in the region that had been implemented in the previous period but were no longer active such as the pacfarmer[12] project was not included in the assessed digital solutions.
Use cases of current digital agriculture solutions in the Pacific SIDS
With the exception of the Maua app in Samoa, the region does not have significant e-commerce solutions for farmer input and output. This in effect excludes the rural farming populations on remote islands like in Papua New Guinea from the transformative market linkage opportunities to e-commerce solutions (for both farmer inputs and outputs) present. There is an absence of the digital agriculture solutions linking smallholder farmers to state-provided extension agents. Since the region relies on smallholder family farms that operate on an average of 1.5 to 2 hectares, the need for specialised farmer support and extension services is more pronounced.
In the above regard, lessons can be drawn from Commonwealth Africa and Asia. In the two regions, USSD and Interactive Voice Response technologies are being used to provide digital extension solutions for farmers, even in the absence of broadband connections. Despite the fact that the Pacific SIDS are highly vulnerable[13] to large-scale climate-related events, among the digital solutions that were profiled, only the Farmis3 app in the region provides a digital solution that provides climate and weather-related advisory to its users. Apart from the Farmis mobile application that has a product offering that spans the farm data management, pre- and post-harvest crop advisory and access to input and output markets for farmers, the other three digital solutions’ offerings are not bundled
State of Drones, IOT and other smart farming technologies
Like in the Caribbean SIDS and Commonwealth Africa, there are a few isolated cases of the use of smart farming implements in the Pacific SIDS. One such case is the use of radiofrequency tags to track pigs in Papua New Guinea that was piloted by FAO.
In addition, drones have also been used in some notable cases, for example, in the Samoa Island to monitor coconut plantations.
Case study: Featured frontier digital agricultural solution in the Pacific Island Commonwealth countries – livestock traceability using blockchain technology in Papua New Guinea
The Government of Papua New Guinea, with support from FAO and Switch Marven[14] (Australia), piloted a key innovation in the Livestock Traceability System using Blockchain Technology in three sites within the Jiwaka province. The province is in the highland region of Papua New Guinea and is home to one of the largest pig populations in the country.
Due to the challenge of remoteness, the region largely did not have significant broadband coverage. To support the effective roll-out of the project, the Government of Papua New Guinea installed wireless broadband in three sites within the Jiwaka province with the aim of providing stable internet connections for the farmers in the region that would be taking part in the pilot project.
Value proposition summary
- Solution includes attaching radio-frequency identification to monitored pigs.
- The solution includes a mobile application to enable farmers to document the pig’s growth.
- Solution includes the use of a distributed ledger to effectively disseminate the data on the pigs at the sale.
- At the point of sale, the information regarding the pig’s growth history can be accessed easily by scanning the RFID tag in the pig’s ear.
Product offering details
General outreach - The system was developed by Switch Marven of Sydney, Australia. The solution used radio frequency identification (RFID)-enabled tags to mark the livestock, these were then linked to the database of a traceability system. As part of the traceability system, a mobile application (PNG pigs), was developed by the Australian company, Switch Marven, and used by the pig farmers during the registration of their pigs. The system continually uploaded performance data via smartphones, which were provided by the Jiwaka Provincial Government.[15]
Farmer support in the adoption process – This pilot was one of the earliest applications to integrate digital solutions in agricultural development following the development of an e-Agriculture strategy for Papua New Guinea, developed by the Government, with support from FAO and the International Telecommunication Union (ITU). The Government subsidised the solution, so no farmer had to pay for the service. In addition, the provisional Government in the Jiwaka province provided support staff to monitor and train the farmers during the piloting of the product. It should also be noted that there was a support team from Switch Marven, and the solution developers were in the province training the farmers on the system’s application during the adoption phase.
Livestock product traceability solution – Interested pig farmers registered with the system and ear-tagged their pigs with a special radio frequency identification device. Farmers input data into the system via a mobile application[16] throughout the life of the pigs until the animals were ready for sale. When ready, potential buyers would visit the pig-selling points with their own mobile applications and scan the ear tags to access individual information about each animal by viewing its history before deciding whether or not to purchase.
5.3.2 Data infrastructure for digitalisation of agriculture in the Pacific SIDS
User identifiers
Unique national identifiers – With the exception of Fiji, Papua New Guinea, Tonga and Vanuatu, all Commonwealth Pacific SIDS have no national identification scheme. In addition, none of the Commonwealth Pacific SIDS have any state-run national farmer identifiers.
Land identifiers – Land in the Pacific SIDS is largely under customary tenure. While the specific percentages vary, Papua New Guinea, Vanuatu, Fiji, the Solomon Islands, and Samoa all have more than 80 per cent of their total land holdings under customary tenure. Customary and other informal rights and norms are often not recognised or recorded. This hence implies that most of the land, while occupied, has no unique identifiers.
Data for content
Weather and soil data - All Pacific SIDS have weather data collected by Government provided metrological agencies. The data is, however, not distributed in any form of API. While no state-run entities run soil data provision services in the region, the global coverage of the (SMOS) data from the European Space Agency also covers the Pacific SIDS.
Yield data – While there are no authoritative sources that document the recordkeeping culture of farmers in the Pacific SIDS, inference can be made about it from the FAO profiles of other smallholder farmers with similar land attributes, ages and production traits.[17] Based on this, many of the farmers do not have historical yield data on their farm operations.
5.3.3 Business development services for digitalisation of agriculture in the Pacific SIDS
Business models - As is the case with the Caribbean SIDS, there is a void of literature that details the business models of financing digital agriculture solutions. Digital solutions developers in the region rely on donor initiatives and AgriTech competitions for funding. A case in point is the Malaita Youth in Business Association (MYIBA), which was one of the recipients of three awards during the Pacific AgriHack Lab competition in Tonga in December 2018.
Pricing and consumer attributes - Agriculture in the Pacific Island Countries (PICs) is largely dependent on family based small-scaled farms. Smallholder family farmers often have access to less than two hectares of land and depend on labour supplied by household members and a few other inputs. While there is no literature that makes specific pronouncements regarding farmer’s willingness to pay for digital solutions in the region, postulations can be made from African and Asian farmers operating under similar conditions and on a similar scale, who are for the larger part unwilling to pay for digital solutions.
5.3.4 Enabling environment for digitalisation of agriculture in the Pacific SIDS
Technology enablers
Connectivity - The proportion of individuals with internet access in the Pacific SIDS is still low for most countries is shown in Table 5.5
Table 5.5: Individuals using the internet (% of population) (Pacific Islands)
|
Individuals using the internet (% of population) |
|
|
Fiji |
50 |
|
Kiribati |
15 |
|
Nauru |
62 |
|
Papua New Guinea |
11 |
|
Samoa |
34 |
|
Solomon Islands |
12 |
|
Tonga |
41 |
|
Tuvalu |
49 |
|
Vanuatu |
26 |
Source: Author computations from the World Bank indicator database.[18]
Unlike the Caribbean SIDS where all countries in the region are connected through at least two submarine cables, there are countries in the Pacific SIDS that are connected through only one cable. This presents a significant connectivity risk since the region is generally very seismically active.
While both fixed-broadband and mobile-broadband subscriptions per 100 inhabitants have increased over time in the Pacific SIDS, the pace of this increment has largely been uneven.
- Tuvalu has improved access to fixed-broadband connectivity.
- Countries like Fiji and Tonga have improved access to mobile-broadband connectivity but have limited access to fixed broadband connection.
- Countries like Nauru have managed to improve access to fixed broadband and mobile broadband. This explains why Nauru has the highest proportion of individuals in the region using the internet
Although electricity consumption has steadily increased for all Pacific SIDS over time, it is still considerably lower as compared with the world’s average. The low electricity consumption in the Pacific States could mean lower access to affordable electricity which is a major deterrent to the expansion of mobile broadband networks.
There is an increasing shift to mobile broadband and 4G connections. 4G alone is projected3 to account for over half of total connections by 2023. This has mostly been driven by the increasing rates of smartphone adoption due to falling smartphone prices and the emergence of new low-cost smartphone providers. Moreover, adoption is projected to grow to 65 per cent by 2025.
Mobile penetration - There is variation in the development of local mobile markets is shown in Table 5.6
Table 5.6: Mobile cellular subscriptions (per 100 people) (Pacific Islands)
|
Mobile cellular subscriptions (per 100 people) |
|
|
Fiji |
119 |
|
Kiribati |
46 |
|
Nauru |
95 |
|
Papua New Guinea |
48 |
|
Samoa |
64 |
|
Solomon Islands |
71 |
|
Tonga |
59 |
|
Tuvalu |
70 |
|
Vanuatu |
88 |
Source: Author computations from the World Bank indicator database.[19]
Overall, the Pacific Islands region is seeing only modest mobile subscriber growth at a time when its subscriber penetration rates remain below regional and global developed market averages.[20]
Non-technology enablers
Large rural populations in the region: Most of the Pacific SIDS have large rural populations (more than 40 per cent of total population), and the majority are young, highly literate but unemployed. High rural population coupled with high unemployment rates of largely youthful population limit effective contribution to the formal economic sector and effectively implies low amounts of disposable income to be spent on broadband connectivity and internet-enabled devices. This reduces the user base for digital agriculture solutions.
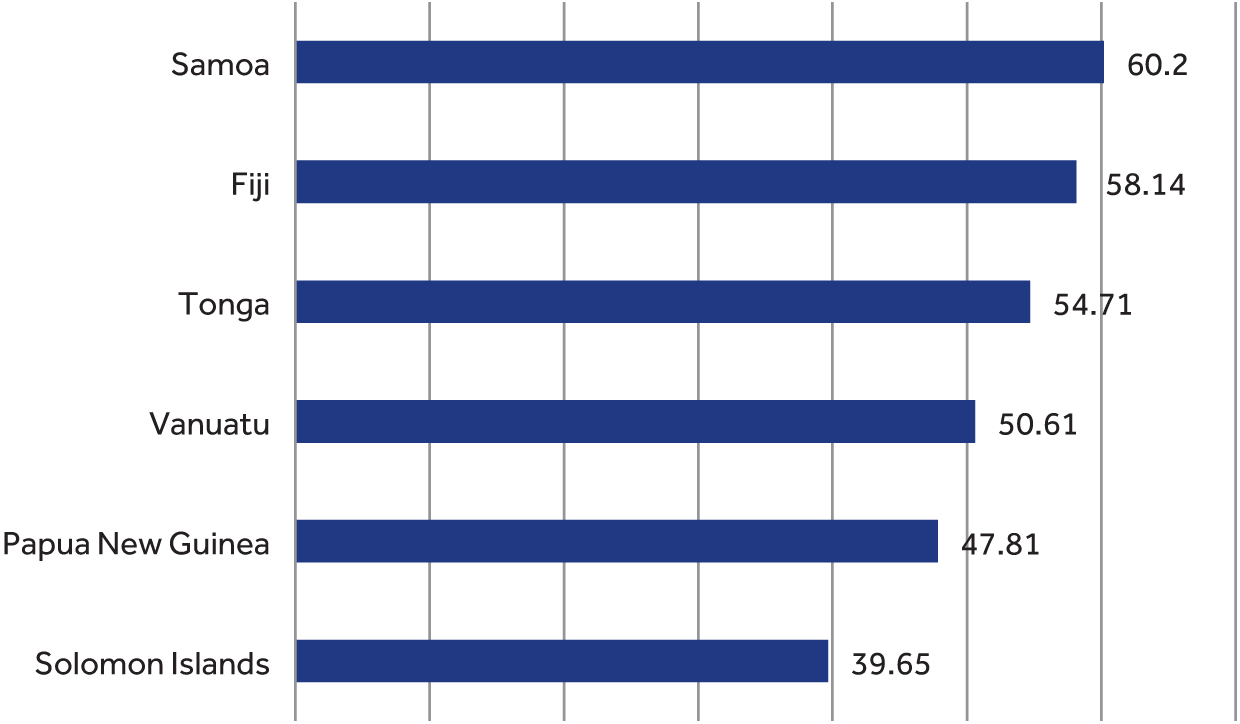
Occurrence of natural disasters: Between 2000 and 2016, the Pacific sub-region experienced 225 natural disasters, causing 1,752 fatalities, affecting 4.7 million people, and causing nearly US$ 50 billion (in 2005 USD) worth of damages. In the short term, there may not be significant infrastructural damage, mobile network operators and internet service providers in the region still have to set aside funds to repair infrastructural damage in case of disasters. This greatly increases the operating expenditures for mobile network operators and drives up the costs of connectivity, a burden that is usually transferred to the consumers. Overall, this section compares the GSMA mobile connectivity indices for the Commonwealth member states as a measure of the enabling environments. All the assessed countries had index scores of less than 60. This score reveals a less enabling environment for digitalisation in the Pacific Island Countries than in the Caribbean Islands. It should also be noted that the island countries of Tuvalu, Nauru and Kiribati in the region had no GSMA index data.
This index has been detailed in the annex and footnote below.
The GSMA mobile connectivity Index[22] measures the enablers of mobile internet connectivity. This index provides an aggregated quantifiable measure for selected indicators enablers of mobile connectivity. These indicators are Infrastructure – the availability of high-performance mobile internet network coverage; Affordability – the availability of mobile services and devices at price points that reflect the level of income across a national population; Consumer readiness – citizens with the awareness and skills needed to value and use the internet, and a cultural environment that promotes gender equality; and Content – the availability of online content and services accessible and relevant to the local population.
In summary: how digital solutions are being leveraged to solve systemic constraints
Snapshot on how digitalisation is being used to solve gender mainstreaming
CTA through the Data4Ag project supported the Women in Business Development Incorporated (WIBDI) in Samoa to digitise over 1,300 farmers and 796 organic certified farms into a digital database which has enabled them to be directly linked to customers.[23]
Increased digitisation and women-led interventions are bound to promote women participation in the agricultural sector and shed light on the significant role they play in supporting national food systems.
Snapshot on how digitalisation is being used to enhance youth employment and entrepreneurship
In the Solomon Islands, The Malaita Youth in Business Association (MYIBA) is an association comprised of like-minded youths and accounts for over 150 young pig farmers who are spread out on the island. The association aims to bring together and economically encourage youths to engage in software development with a focus on agribusinesses. The association created the MalAgri application which can be used both online and offline in a bid to bridge the gap brought about by the remote nature of the island.
Snapshot on how digitalisation is being used to enhance agricultural productivity
Several digital innovations have been developed in different SIDs in a bid to improve agricultural productivity. These range from solutions linking farmers to buyers, traceability systems, among others. Some of the developed solutions in this regard are as follows:
- In Fiji, TraSeable Solutions, a tech startup is providing traceability software for agriculture and fisheries.
- The Farm to Table app introduced by the Women in Business Development (WIBDI) in Samoa has helped link more than 1,300 small-scale farmers to buyers.
- The Malaita Youth in Business Association (MYIBA) in the Solomon Islands developed the MalAgri app to help value chain actors improve sales.
Snapshot on how digital is being used to solve market, trade and supply chain constraints
The Farm to Table app introduced by the Women in Business Development (WIBDI) in Samoa has helped link more than 1300 small-scale farmers to buyers in restaurants and hotels2. Different actors in the restaurant sector can place orders and make purchases directly from the app. The app was developed with the support of the technical centre for agricultural and rural co-operation (CTA). The emergence of such innovations pave way for the use of digitalisation in solving market, trade and supply chain constraints.
Snapshot on how digitalisation is being used to enhance access to finance and investment in the Pacific SIDS
Vodafone, a major mobile network operator in Fiji, embarked on the deployment of 75 mobile village agents in remote locations of the country in a bid to enhance the usage of digital financial services in the country. Bringing digital financial services closer to the people will play a huge role in increasing financial access among the small-scale farmers in the SIDS.
Snapshot on how digitalisation is being used to tackle climate change
Early warning systems (EWS) are used in the Pacific SIDS, where signals from rain and river gauges with electromechanical transducers are transmitted to central computers and ensuing warnings are issued to the affected populations. Five countries, Fiji, Papua New Guinea, Solomon Islands, Timor-Leste, and Vanuatu, partnered with the World Meteorological Organisation to build the Green Climate Fund Project that is aimed at building resilience of the (Early Warning Systems (EWS) of the SIDS.[24] Global satellite tracking weather systems have also played a major role in disseminating eminent threats to affected regions.
5.4 Policy recommendations to fast-track digitalisation of agriculture in the Pacific SIDS
5.4.1 Digital innovations
Gaps (factors limiting innovation and scalability in digital agriculture)
- Existence of a significant number of largely subsistence farmers. As noted by FAO, several farms in the Pacific Island countries are smallholders that predominately use male family labour. As is the case with several other smallholder farmers in other regions like Africa and Asia, the incentive to consume digital agriculture solutions based on profitability remains largely non-existent due to minimal mechanisation and the use of inputs. This effectively reduces the consumer bracket of digital agriculture solutions in the region.
- Low state-provided expenditure on Government research and development into digital agriculture and smart farming technologies. The Governments in the region have not made significant investments in research and development of digital agriculture solutions. In the absence of large-scale private entities in the region that can spend on digital agriculture research as is the case in countries with high per capita gross national incomes, this leaves a funding void for the development of digital agriculture solutions in the region.
- Existence of a lower mobile subscriber base – The Pacific Islands region is seeing only modest mobile subscriber growth at a time when subscriber penetration rates remain well below regional and global developed market averages. Only 38 per cent of the population subscribed to a mobile service as at the end of 2018, this trails the average for least developed countries (44 per cent). Low mobile connectivity effectively means that most of the farmers in the region do not have mobile-enabled internet appliances which are usually the primary connection medium for most smallholder farmers.
- Lack of coordinated and organised innovation ecosystems. Most Pacific SIDS still lack properly developed innovation ecosystems due to the limited size of the individual markets. The absence of a coordinated innovation ecosystem effectively slows down the development, testing and roll-out of digital agriculture solutions.
Table 5.7: Policy Recommendations to close identified gaps
|
A. Use support measures to provide support to actors in the sector that has a potential to promote (champion) investments that are building the rails for digitalisation of agriculture |
Real-world examples where the suggested measures have been used |
|
A.1 Provide R&D support, including R&D incentives, funding for basic research and R&D grants. |
The United Kingdom – The UK R&D tax credit scheme was introduced in 2000 in order to provide better Government funding for R&D in small- and medium-sized businesses. A recent econometric analysis by the UK Treasury concludes that recipient companies in total spend twice the amount they receive on R&D tax credits on actual product development and design |
|
A.2 Provision of targeted subsidies in the region to facilitate the adoption of the digital agricultural solution. |
Papua New Guinea’s – A notable example in this case is the Government of Papua New Guinea’s support in the roll-out of the livestock radio frequency tracking solution in the Jiwaka province. This provides opportunities for potential digital agriculture solution users that would otherwise not have used the digital solutions to experience it first hand at no cost. This is done by having the Government foot some critical expenses that the entity would otherwise have been unable to cover. |
|
A.3 Formulation of strategic partnerships with international bodies and technology companies. |
Again, a case in point is the Government of Papua New Guinea partnering with FAO and Switch Marven (an Australian technology company) to provide technical assistance and support in the delivery |
|
B. Create an ecosystem that would allow digital innovation to thrive |
Real-world examples where the suggested measures have been used |
|
B.1 Create regulatory sandboxes that provide an environment for companies to experiment with innovative fintech products and services |
Monetary Authority of Singapore: The FinTech Regulatory Sandbox allows firms to test their products in the market within a clearly defined space. The rules are that they can do so only for a limited period and with a limited number of customers or transactions |
5.4.2 Data infrastructure
Gaps in the data infrastructure required for digitalisation of agriculture in the Pacific SIDS to thrive
- There is an inadequate amount of data on the agriculture sector and innovations going on in the region, specifically the progress of rolled out solutions in the Agritech space.
- Where bulk data is collected by the Government, this is not available to private sector actors through open Application Programming Interfaces (APIs).
- Absence of robust linkages among different forms of identifiers. In the ideal arrangement, person identifier data (such as national identification) is linked to farm data such as soil property data, land titles and livestock data. This linked data set is then used to create advanced digital agriculture solutions by enabling the creation of solutions that are based on the relationships in such data sets. From the deep dive into the literature review, most of the countries in the Pacific SIDS have customary and informally registered land. In scenarios where identifiers are present, there are hardly linkages among the different identifiers issued.
Table 5.8: Recommendation for Pacific Islands to increase investment in data infrastructure
|
C. Boost investment in data infrastructure and their key enablers |
Real-world examples where the suggested measures have been used |
|
C.1 Governments should increase efforts to build robust national Agri statistical systems |
The European Union – In the European Union, Governments have established robust national Agri statistical systems that hold regular annual farmer surveys, and decennial farmer census events. This ensures that representative of the data to guide macro-level decisions regarding the region’s agriculture is present |
|
C.2 Distribution of weather data collected by state entities in the region |
South Africa – The South African Government collects and distributes weather data via state issued APIs. Developers in the country have the option of getting weather data from a free Government resource as opposed to obtaining this data from a third party at a cost. This trickles down into lower costs to the end user |
|
C.3 Soil data collection and distribution should be undertaken by Government entities |
India – Though not fully digitalised, the Indian authorities map and document the soil attributes of an estimated 120 million farmers, many of whom are smallholder that would otherwise have been largely unwilling to pay for this data. Availability of detailed soil attribute data is a critical first step in the creation of robust digital agriculture datasets. That can later be leveraged for digital solutions |
|
C.4 Invest in formalisation and digitalisation of land tenure for smallholder farming entities. |
Rwanda – The Rwandan Government invested in a digital land registry that has been used to document the use rights on an estimated 10.1 million parcels. This in effect ensures that the farmers on this land have a more secure digital record of their claim to land parcel, and this can even be used to unlock financing[25] |
|
C.5 Investing in farmer data protection legislation |
The European Union – The EU Code of conduct on agricultural data sharing by contractual agreement ensures that the collection and use of farm data by technology companies does not hurt the interests of the individual farming entities. It ensures that the prior informed consent of farmers is sought in advance before their data is used by or shared with third parties |
5.4.2 Business development services
Gaps (factors hindering the flow of financing to digital innovations in agriculture)
- Low state-provided expenditure on Government research and development into smart farming. The Governments in the region have not made a significant investment into research and development of digital agriculture solutions. In the absence of large-scale private entities in the region that can spend on digital agriculture research as is the case in countries with high per capita gross national incomes, this leaves a funding void for the development of digital agriculture solutions in the region.
Table 5.9: Policy recommendations to close identified gaps
|
D. Work through sector champions to graduate smallholders and unlock systemic constraints |
Real-world examples where the suggested measures have been used |
|
D.1 Support smallholder farmers in their transition to commercial agriculture from small-scale agriculture. This could be through creating linkages to input and output markets |
The South Asian Countries, of Pakistan, India and Bangladesh – These countries of these countries have robust state provided extension services that distribute subsides in form of fertiliser and other inputs for Governments. They also provide cost free advisory to the smallholder frames regarding input use and the marketing and auctioning of agricultural produce |
|
D.2 Incentivise solution providers to sell products through cooperatives instead of directly through smallholders |
Kenya – A classic example to this regard is the Siongiroi Dairy Farmers Cooperative in Kenya that use a mobile app to schedule collecting and distribution of their dairy products. While all the farmers in the corporative use the solutions, it is paid for via an annual fee by the cooperative on the smallholder farmer’s behalf |
5.4.4 Enabling environment
Gaps in the enabling environment required for digitalisation of agriculture to thrive
- Largely absent smart farming regulation. There is a void of regulation that covers emerging trends in the use of big data, Unmanned Aerial Vehicles (UAVs), and Blockchain in the facilitation of digital agriculture. Such regulation is critical for the growth and use of digital agriculture.
- Tax policy that increases the cost of mobile devices. As of 2018, Pacific SIDS had higher import tariff rates on mobile devices as compared to The Economic and Social Commission for Asia and the Pacific (ESCAP) and world averages. While it may be argued that this is a prudent fiscal measure, it could have an adverse effect on accessing several affordable ICT goods (including mobile phone devices). For most smallholder farmers, mobile devices are in many cases the primary access medium for digital agriculture solutions. High import tariffs make them prohibitively expensive which excludes many potential consumers simply because of the initial cost of access to a mobile device.
Table 5.10: Policy recommendations to close identified gaps
|
E. Investment in putting in place an infrastructure required for digitalisation to thrive and formulate policies that are in tune with technology evolution |
Real-world examples where the suggested measures have been used |
Pillar/element that the suggested recommendation responds to |
|
E.1 Provide and extend digital infrastructure as fibre infrastructure. |
Australia – The Australian Government has invested in the creation of the Australian national wholesale open-access data network that includes the wired and radio communication components rolled out and operated by a publicly owned corporation. Internet service providers, contract with Government to access the data network and sell fixed internet access to end users |
Digital Innovations |
|
E.2 Increased Government expenditure to close the growing electricity grid coverage gap. |
The Philippines – The Electric Power Industry Reform Act of 2001 mandates, among other things, that the department of energy shall encourage private sector investment in enhancing electricity grid coverage using renewable energy sources. This reduced the regulatory burden on private sector entities that are spending on increasing the coverage of the national electricity grid coverage mainly relying on renewable energy |
Digital Innovations |
|
E. Investment in putting in place an infrastructure required for digitalisation to thrive and formulate policies that are in tune with technology evolution |
Real-world examples where the suggested measures have been used |
Pillar/element that the suggested recommendation responds to |
|
E.3 Formulate standards to guide the use and implementation of digital technologies and advanced technologies (e.g., Blockchain, satellite imaging, AI and 5G) |
Australia – Australian authorities as early as 2002 went ahead to have a major overhaul of domestic regulations regarding the commercial and industrial use of unmanned aerial vehicles.[26] This hence means that the use of unmanned aerial technology in the country is overseen by the National Government of the region. With agriculture projected to be the major consuming sector for drones by the end of 2027, this is an exemplary move in the right direction |
Digital Innovations |
In conclusion, the most undeveloped element of the D4Ag structure in this region is the ‘base’ of an enabling environment. As witnessed in the Caribbean Island countries, the often-challenging topography is a major limiter to the provision of mobile coverage. In addition, low population densities in several remote locations and a relatively modest population cause operators and other ecosystem players often struggle to scale up the provision of relatively small services and deployments in a cost-effective manner. Addressing these may require collaboration between players from across the mobile ecosystem, as well as a supportive regulatory and policy environment that encourages investment and innovation. Partnerships between public and private sector players may be the ultimate initiative that influences the roll-out of wireless broadband coverage to locations that may be too remote and sparsely populated to be considered lucrative by the private sector.
The following are necessary for the recommendations to yield results.
Capacity building at a policy level is required. Capacity building of key decision-makers is necessary to empower them to make rules and regulations that are responsive to the fast-paced nature of technology innovations. In addition, empowering policy-makers in the region will enable them, identify, develop and roll out digital solutions with the most potential to transform the region’s agriculture. Capacity building could be through the following:
- Facilitating benchmark visits to other Commonwealth countries where laws on technology are updated.
- Working with capacity-building partners who would carry out a capacity gap assessment and thereafter develop targeted capacity-building programmes.
- Identification of a capacity-building partner to develop and roll out the relevant programmes.
- There is a need to use an integral programming approach that involves different ministries as opposed to using only the ICT ministry.
5.5 State of digital agriculture in Australia and New Zealand
5.5.1 Digital innovations for digitalisation of agriculture in Australia and New Zealand
Use cases of digital agriculture solutions
One hundred and sixty-three digital agriculture solutions from the two countries were assessed. Assessed solutions including smart farming solutions leveraged Internet of Things technologies and other smart farming methods.
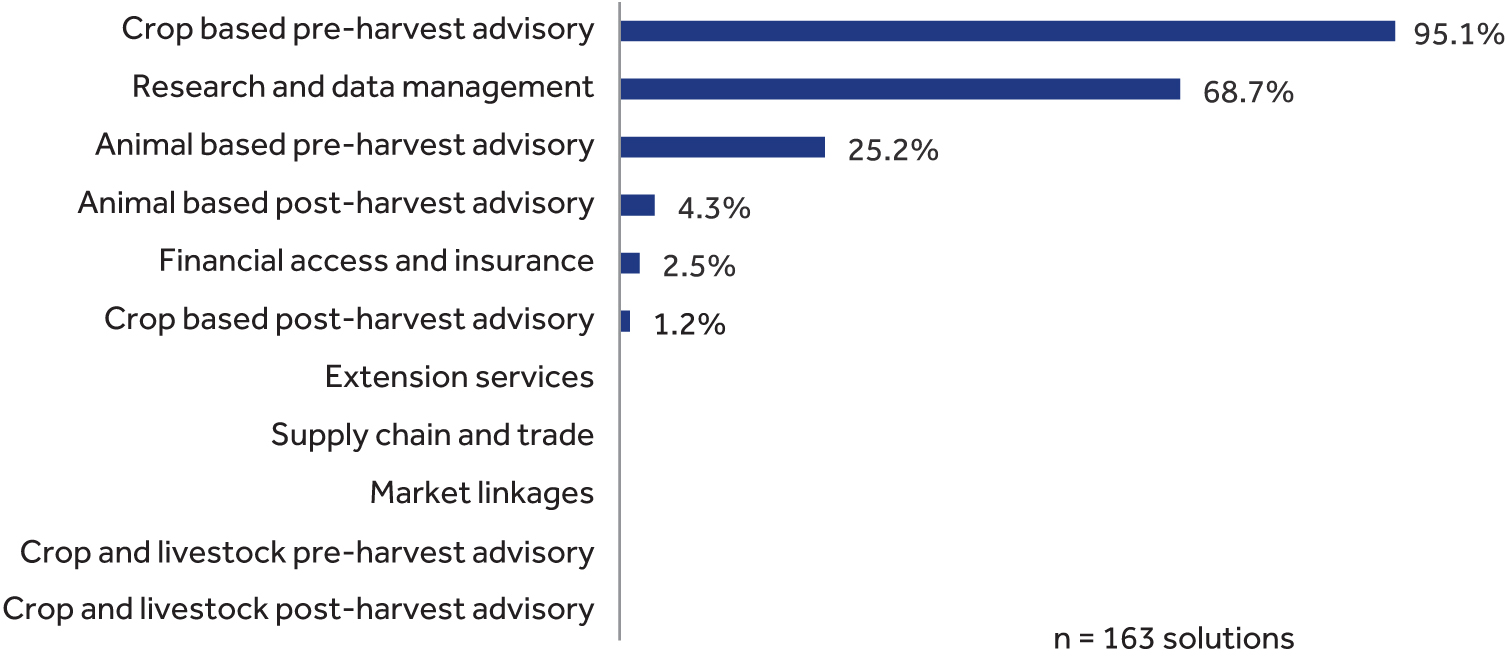
Majority of the solutions offer crop-based preharvest-advisory services. This arises because advisory is not offered as a single solution but as a bundled service with other digital agriculture value propositions. Most of the crop-based preharvest-advisory digital agriculture solutions are paired with some form of hardware like on-the-ground soil sensors, aerial imagery satellites, and more. The data collected during the operation of the physical hardware devices is transmitted by various sensors and delivered to dashboards for interpretation by the device owners.[27]
Most of the assessed solutions (68.7 per cent) in Australia and New Zealand have data management and research as part of their product offering. This is a use case that is equally being explored in Canada but lacking from regions that are predominantly characterised by smallholder farmers. Leveraging research and data has led to more intensive farming and increased productivity in the agriculture sector.
As is the case in Canada, digital agriculture offerings in Australia and New Zealand are bundled with agricultural equipment offerings. Solution providers typically form partnerships with prominent providers that offer mechanisation services.[28]This comes as a result of the scale at which the farms operate (typically large-scale farms). The large scale of operations creates an incentive for the use of smart farming methods due to their cost reduction potential.
Characteristics of digital agriculture solutions
- More than 73 per cent of the digital agriculture solutions in regions are private sector led.
- All assessed solutions rely on the internet as a delivery mechanism.
Utilisation of Drones, IOT and other smart farming technologies
The export-focused nature of Australian agriculture has greatly contributed to the need for Australian farmers to innovate in order to remain internationally competitive. Australian farmers are some of the largest users of smart farming technology among Commonwealth member countries. By 2011, an estimated 30 per cent of crops that were mainly grown on a scale were already being sown and sprayed using GPS guidance technology on Australian farms.[29]
Other smart farming technologies such as yield mapping and variable rate application (application of materials based on properties of the land that materials are being applied on) are less common with less than 1 per cent of farmers in the region adopting the technology.
Similar to what is observed in Canada, the phenomenon of selling digital solutions with smart farming hardware like variable rate application devices and combine harvesters also occurs with hardware providers like Cropx also providing digital agricultural solutions.
While there is a significant use of aerial-related technology like Normalised Difference Vegetation Index (NDVI) computations from aerial photography,[30] there is a lack of conclusive publicly available literature that clearly documents the extent of this phenomenon in Australia and New Zealand.
Case study: Featured frontier digital agricultural solution in the New Zealand and Australia– Cropx New Zealand
CropX[31] is an Israeli agri-tech firm founded in 2015 that aims to provide farmers with reliable data from below the ground in addition to other data layers. Its do-it-yourself soil sensors can be installed by farmers in about 5 minutes, and it uses cloud-based software to create a comprehensive picture of the condition of a field – even the sections that are between the sensors. The simplicity of the CropX solution means that it has quickly expanded around the globe and is serving customers even amid the disruptions and travel restrictions caused by the coronavirus pandemic. There are different antennas for several crop types and various transmission protocols, including Bluetooth, 3G, 4G and even satellite transmission. The most important thing that the company managed to solve was the issue of data accuracy. The vast majority of soil sensors out there are inaccurate because they disturb the soil: When you put something in the ground, there is always a gap between the soil and the sensor, and after an irrigation event or a rain event, the water flows straight down the sensor to the bottom.
Value proposition summary
- Soil attribute detection using soil sensors that measure volumetric water content, temperature and electric conductivity.
- Ag-specific weather data services to obtain precise weather information relevant to the users and CropX’s algorithms.
- High-resolution aerial images from several sources, using NDVI, NDWI and MSI.
Topography Maps in the placed terrain to assess the impact and movement of water resources.
Product offering details
General outreach – CropX developed the first, and still the only, do-it-yourself soil sensor. It can be installed by a farmer in about 5 minutes. It is inexpensive and effective in transmitting data out of the field into the cloud. Because they have hardware and software development and agronomy all under the same roof, they were able to come up with a multidisciplinary product. Thanks to that, they are able to spread out the sensors widely in the field, significantly reducing the cost per acre (on average, one sensor for every 25–30 acres). They are able to use fewer sensors due to positioning them in the right place in the field.
Commercial use and adoption – When a farmer downloads the app for installation, the Cropx infrastructure automatically performs soil analysis and is able to tell them where to put the sensors in real time. Cropx infrastructure is able to extrapolate data from and in between the sensors. This leverages machine learning technology using data among the various sensors. No matter where the farmer puts his sensor on the field, the Cropx infrastructure is able to tell how much water is at that point at an accuracy of 95 per cent, even in between sensors.
Saving water is an immediate result of Cropx use. Customers that use the Cropx infrastructure have reduced their farm water consumption by up to 50 per cent. Many commercial experiments are backed by third parties, so they are able to prove the Cropx infrastructure key performance indicators. CropX has also helped farmers save energy, turning a pivot around a circle once takes a day can save an estimated $500 in energy costs alone. CropX allows a farmer to realise that their crop has enough water and that they do not need to turn the pivot for further irrigation which enables them to save money. The Cropx infrastructure also facilitates compliance with the regulation in jurisdictions like the United States and Israel where water use quotas on farmlands exist.
5.5.2 Data infrastructure for digitalisation of agriculture in Australia and New Zealand
Data for content
Weather data: Both Australia and New Zealand have Government-run metrological departments that collect weather data. Only the Australian Meteorological Authority has a government weather API that providers of weather-related solutions can tap into.
National agri-statistical data: Both Australia and New Zealand have national agriculture sector surveys that are carried out annually, by the respective statistical entities.
Farm-level data: Commonwealth Scientific and Industrial Research Organisation (CSIRO) estimates that in Australia, 87 per cent of the farmers collect at least one type of data. The most collected data is financial data, followed by yield mapping data and soil mapping data. CSIRO further estimates that, in Australia livestock industries, 91 per cent of respondents collected at least one type of data. The most collected data was financial data and veterinary medicine records. In general, all types of data were regarded as quite useful in informing farm management decisions. While no information elaborately documents the presence of farm-level data in Australia and New Zealand, the above facts coupled with the scale and nature of existent farming operations in the two countries can be used as a basis for the inference that farm-level data is largely existent.
User identifiers
Primary identifiers for farmers: In both New Zealand and Australia, there is no database that accurately includes all production farms and farmers. All currently available data includes farms that are recognised as business entities. Farms that are not legally registered as businesses are excluded from official farm registers in these countries.
Primary identifiers for farmers land parcels: Both New Zealand and Australia have robust land information systems that are linked to hydrographic and property information. While there is secondary evidence that existent land and person identifiers are linked, there is limited publicly available information that documents the extent of this linkage.
5.5.3 Business development services for digitalisation of agriculture in Australia and New Zealand
Business models: Most digital agriculture solutions in the region are private sector led. Except for the state-provided applications such as APIs provided by the Australian Bureau of Meteorology that rely on public financing, the majority of digital solutions in the region are started with funding from private entities such as companies and individuals that have a profit-making incentive. This could be explained by the fact that Governments in these countries have invested in enabling infrastructural and regulatory environments to enable the inflow of capital to the development of smart farming.
Pricing: Most large-scale farmers are often willing to pay for digital agriculture solutions. As is the case in countries like Canada and United Kingdom where production is done at scale, the incentive for consumption of digital agriculture solutions in New Zealand and Australia is based on the cost reduction potential of digital solutions, particularly through targeted application of inputs.[32] Given the primary reason for adoption is the cost reduction potential of digital, and smart farming, many digital agricultural solutions in the region are mainly reliant on subscription fees of consumers. This is similarly the case in Canada and United Kingdom.
5.5.4 Enabling environment for digitalisation of agriculture in Australia and New Zealand
Technology enablers
Internet penetration rates: Australia and New Zealand have some of the highest proportions of people using the internet as shown below.
Table 5.11: Individuals using the internet (% of population) (Australia and New Zealand)
|
Individuals using the internet (% of population) |
|
|
Australia |
87 |
|
New Zealand |
91 |
Source: Author computations from the World Bank indicator database.[33]
The drivers of high internet penetration and connectivity are presented as follows:
Australia and New Zealand are connected internationally through marine and terrestrial cabling.
New Zealand currently has two major international submarine cables: Southern Cross (owned by Telecom, Singtel-Optun and Verizon Business) that connects New Zealand to the USA; and Tasman 2 (owned by Telstra & Telecom) connects New Zealand to Australia. Australia on the other hand, unlike other pacific island countries, has more than 12 cable landing stations, 16 on the West Coast and an additional five on the East Coast.[34]
Both countries have a considerably wider coverage of wireless broadband networks, with Australia ahead of all Pacific Island countries.
After launching 5G in 2019, Australia has some of the fastest mobile speeds in the world with median download speeds of 283.56 Mbps during the first quarter of 2021, nearly double the global average of 142.05 Mbps. This can be attributed in a large part to the years Australia, and its mobile operators have spent investing in 5G infrastructure across the country. Australia is widely anticipated to continue to be at the forefront of global 5G.[35]In both New Zealand and Australia, the broadband coverage range of 4G networks is over 90 per cent of the national land area. Such high broadband connection rates in the three countries facilitate the deployment of IOT devices and real-time crop and animal monitoring infrastructure in agricultural operations.
Mobile penetration - In both Australia and New Zealand, mobile penetration is high. High penetration of mobile devices increases the adoptive potential of digital agriculture solutions.
Table 5.12: Mobile cellular subscriptions (per 100 people) (Australia and New Zealand)
|
Mobile cellular subscriptions (per 100 people) |
|
|
Australia |
110.62 |
|
New Zealand |
134.93 |
Source: Author computations from the World Bank indicator database.[36]
Non-technology enablers
Sizes of agricultural land: As aforementioned, agriculture in both New Zealand and Australia is characterised by the presence of few farms, but of very large sizes. Average farm sizes are shown below.
- Australia – 10,702 acres (4,331 hectares)
- New Zealand – 667 acres (270 hectares).
As seen in locations with similarly large commercial farming arrangements, farm sizes of more than 200 hectares are ideal for use of smart farming methods in order to recuperate return on investment, through more effective application of agricultural inputs like water, pesticides and fertilisers at scale.
High Literacy Rates: The Organisation for Economic Co-operation and Development puts the adult literacy rates in both New Zealand and Australia over 95 per cent. High levels of adult literacy mean that farmers do not have the literacy barrier to the consumption of digital solutions and have a much better appreciation of the role of technology in increasing the productive potential of agriculture.
Large-scale monoculture (growing one crop) as opposed to inter-cropping more than one crop on the same plot of land: Utilisation of aerial imagery is hard when more than one crop is grown on the same piece of land. Aerial imagery thrives in Australia and New Zealand because monoculture is practiced on a large scale in most existent farming operations.
5.6 Lessons from digitalisation of agriculture in Australia and New Zealand
Government partnerships with the Private Sector to foster e-resilience. The Governments of Australia and New Zealand have formed strategic regional partnerships with private sector players to build and cost-effectively maintain the countries' international submarine connections. This has facilitated development and maintenance of several submarine cable connections. Other island countries in the Commonwealth can also take the direction of public-private partnerships to foster e-resilience, especially those in places when the maintenance of sub-marine connections is subject to the effects of climate change.[37]
Governments should update regulations regarding smart farming in the region. The Australian authorities as early as 2002 went ahead to have a major overhaul of these regulations. By the end of early 2016, the updated regulations had taken effect. This hence means that the use of unmanned aerial technology in the country is overseen by the national Governments of the regions. With agriculture projected to be the major consuming sector for drones by the end of 2027, many Commonwealth countries can follow in the Australian Government footsteps in the creation of legislation that will enable the safe and effective use of drones, as they continue to take a more dominant role in global smart farming.[38]
Creation of agricultural export farmer registries. The Governments of Australia and New Zealand have both invested in the development and regular updating of national agricultural export farmer registries. These foster trust in the exported products of the countries in the destination of the exported commodities due to the presence of a digital export registry that enhances product traceability. Many Commonwealth countries on the other hand grow agricultural produce for export but have no state-provided digital solutions to enhance product traceability.[39]
Government roll-out of smart farming subsidies. With the nationwide implementation of programmes such as the National Agricultural Innovation Agenda, the Governments of Australia and New Zealand have included the development and mainstream adoption of smart farming technologies into their national agriculture policies. In many other Commonwealth countries, smart farming is largely dominated by private sector activity. The involvement of the public sector in the development of digital agriculture through drafting regulation, and the significant spending on smart farming research and development greatly lowers the risk shouldered by the private sector.[40]
Digital Agriculture report homepage Next chapter Back to top ⬆
[1] Chen, C. and I. NobleHellmann, J. 2015. University of Notre Dame Global Adaptation Index. https://gain.nd.edu/our-work/country-index/matrix/
[2] World Meteorological Organisation (2017). Shoring up early warning systems for Asia-Pacific SIDS. https://public.wmo.int/en/media/news/shoring-early-warning-systems-asia-pacific-sids
[3] Food and Agriculture Organisation of the United Nations, FAOSTAT. Data retrieved on August 8th, 2021. Retrieved from http://www.fao.org/faostat/en/#data
[4] FAO (2014). FAOs Work with Small Island Developing Countries. http://www.fao.org/3/ca5170en/ca5170en.pdf
[5] United Nations Conference on Trade and Development, UNCTAD maritime connectivity. Data retrieved on August 8, 2021. Retrieved from https://unctadstat.unctad.org/wds/TableViewer/tableView.aspx?ReportId=92
[6] COVID-19 and food systems in Pacific Island Countries, Papua New Guinea, and Timor-Leste: Opportunities for actions towards the sustainable development goals. https://www.sciencedirect.com/science/article/pii/S0308521X21000901
[7] ABC RN Breakfast (2020). How has COVID-19 impacted Australia's agriculture sector? https://www.abc.net.au/radionational/programs/breakfast/how-has-covid19-impacted-australias-agriculture-sector/12149370
[8] RNZ (2020). New Zealand food exports still in demand despite Covid-19 impact. https://www.rnz.co.nz/news/business/415638/new-zealand-food-exports-still-in-demand-despite-covid-19-impact
[9] Australian Government Department of Agriculture (2020). Industry engagement on COVID-19 Issues. https://www.agriculture.gov.au/coronavirus/industry#agriculture-workforce
[10] Australian Government Treasury (2020). Job Keeper Payment. https://treasury.gov.au/coronavirus/jobkeeper
[11] Taylor, M., A. McGregor and B. Dawson (2016). Vulnerability of Pacific Island agriculture and forestry to climate change. https://www.uncdf.org/article/3990/pacfarmer-app
[12] Sherzad, S. (2018). Family Farming in the Pacific Islands Countries.
[13] https://www.switchmaven.com/ (accessed on July 14, 2021).
[14] FAO (2017). Pig farmers in Papua New Guinea capitalize on blockchain technology. http://www.fao.org/in-action/pig-farmers-in-papua-new-guinea/en/ (accessed on July 14, 2021).
[15] https://play.google.com/store/apps/details?id=org.nativescript.pngblockchain2&hl=en_AU&gl=US (accessed on July 14, 2021).
[16] Sherzad, S. (2018). Family Farming in the Pacific Islands Countries. http://www.fao.org/family-farming/detail/en/c/1145658/
[17] The World Bank, World Bank indicator database. Data retrieved on August 8, 2021. Retrieved from https://data.worldbank.org/indicator/IT.CEL.SETS.P2
[18] The GSMA index is a quantitative score running from 0 (environment is least enabling) to 100 (environment is most enabling).
[19] The World Bank, World Bank indicator database. Data retrieved on August 8, 2021. Retrieved from https://data.worldbank.org/indicator/IT.NET.USER.ZS
[20] Global System for Mobile Communications (2019). The mobile economy in the Pacific island countries. https://www.gsma.com/mobileeconomy/wp-content/uploads/2020/03/GSMA_MobileEconomy2020_Pacific_Islands.pdf
[21] The GSMA index is a quantitative score running from 0 (environment is least enabling) to 100 (environment is most enabling).
[22] Global System for Mobile Communications (2020) Mobile Connectivity index (Methodology).
[23] Food And Agriculture Organisation (2018) Samoa – Women in Business Development. http://www.fao.org/asiapacific/perspectives/digital-villages/sids-dvi/ar/
[24] Green Climate Fund (2017). Shoring up early warning systems for Asia-Pacific SIDS. https://www.greenclimate.fund/news/shoring-up-early-warning-systems-for-asia-pacific-sids
[25] Global Challenges: Certification (2017). Securing Land Rights: Making Land Titling Work In Rwanda, 2012–2017. https://successfulsocieties.princeton.edu/publications/securing-land-rights-making-land-titling-work-rwanda-2012-2017
[26] Bone, E. (2003). Unmanned Aerial Vehicles: Background and Issues for Congress. https://irp.fas.org/crs/RL31872.pdf
[27] McCallum, M. and M. Sargent (2008). The Economics of adopting PA technologies on Australian farms. 12th Annual Symposium on Precision Agriculture Research & Application in Australasia. The Australian. https://www.researchgate.net/publication/320908156_Adoption_of_Precision_Agriculture_Technologies_in_Developed_and_Developing_Countries
[28] Commonwealth of Australia (2005). Trends in Australian Agriculture. https://www.pc.gov.au/research/completed/agriculture
[29] Cook, S.E. and R.G.V. Bramley (2011). ‘Precision agriculture – Opportunities, benefits and pitfalls’. Australian Journal of Experimental Agriculture, Melbourne 38, 753–763. https://www.researchgate.net/publication/240507648_Precision_agriculture_-_Opportunities_benefits_and_pitfalls_of_site-specific_crop_management_in_Australia
[30] Australian Government Bureau of Meteorology (2021). Map Information – Normalised Difference Vegetation Index. http://www.bom.gov.au/climate/austmaps/about-ndvi-maps.shtml
[31] https://cropx.com/ (accessed on July 14, 2021).
[32] Zhang, A. and I. Baker (2017). Accelerating precision agriculture to decision agriculture: The needs and drivers for the present and future of digital agriculture in Australia. https://www.crdc.com.au/precision-to-decision
[33] Author computations from the World Bank indicator database. https://www.submarinecablemap.com/ (accessed on 14th July 2021).
[34] Vodafone (2021). Mobile Coverage – Maps. Check out our 5G coverage. https://www.vodafone.co.nz/network/coverage/
[35] Spark New Zealand (2021). Spark Network coverage and compatibility. https://www.spark.co.nz/shop/mobile/network.html
[36] Author computations from the World Bank indicator database. https://www.submarinecablemap.com/ (accessed on July 14, 2021).
[37] Global System for Mobile Communications (2020). The mobile economy North America. https://data.gsmaintelligence.com/research/research/research-2020/the-mobile-economy-north-america-2020#:~:text=In%202019%2C%20mobile%20technologies%20and,almost%20%24100%20billion%20through%20taxation
[38] Food and Agriculture Organisation (2018). E-agriculture In Action: Drones For Agriculture.
[39] http://www.bom.gov.au/catalogue/data-feeds.shtml (accessed on July 14, 2021).
[40] https://www.agriculture.gov.au/export/from-australia/documentation-registration-licensing (accessed on July 14, 2021).
Digital Agriculture report homepage Next chapter Back to top ⬆