
4. Commonwealth Caribbean and the Americas
4.1 Overview of agriculture in Commonwealth Caribbean and the Americas
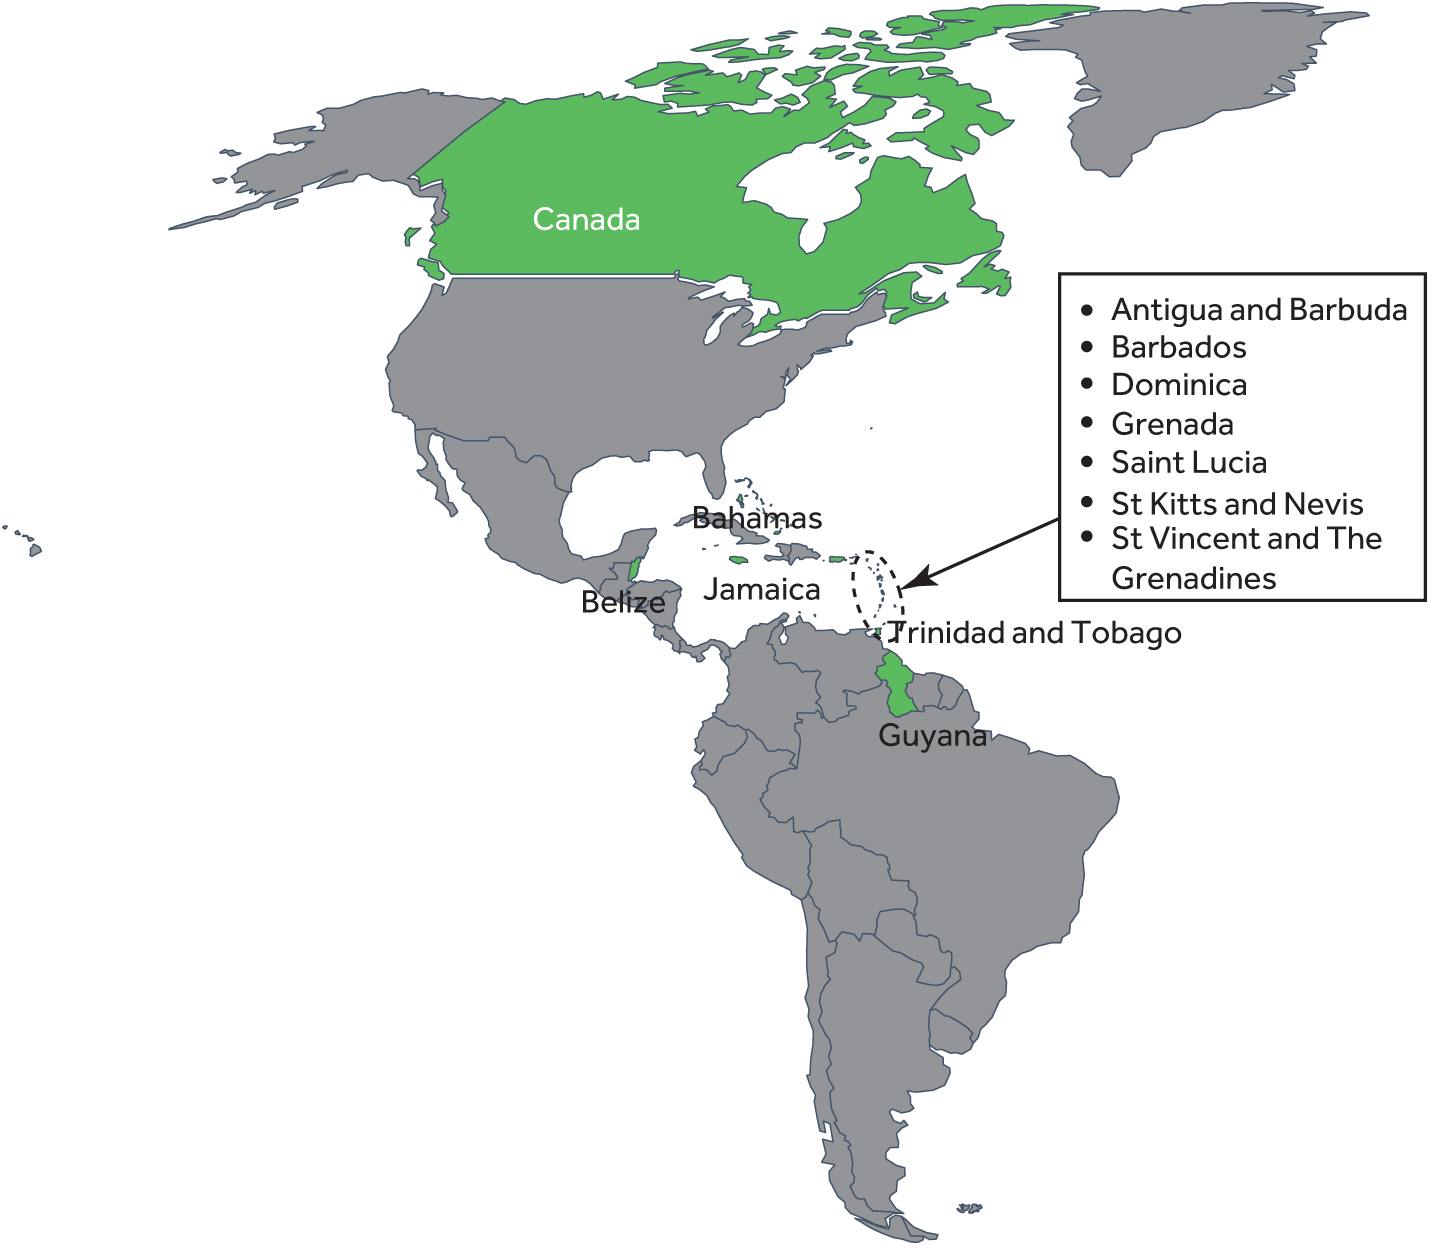
The Caribbean and Americas Commonwealth is made up of 13 countries. These include Antigua and Barbuda, Bahamas, Barbados, Belize, Canada, Dominica, Grenada, Guyana, Jamaica, Saint Lucia, St Kitts and Nevis, St Vincent and The Grenadines, and Trinidad and Tobago. In this study, based on their characteristics, they have been split into two (2) categories. (1) Caribbean Small Island Developing Countries (SIDS) and (2) Canada.
4.1.1 The Caribbean small island developing countries (SIDS)
The Caribbean SIDS is made up of island countries that mostly share similar characteristics thus conduct similar agricultural activities, face similar climate shocks such as hurricanes as well as developmental challenges. Agriculture, forestry, and fishing contributes 5.62 per cent to the GDP[1] of the Caribbean SIDS and employs 9.42 per cent of the population. The low contribution to GDP can be attributed to the fact that for most SIDS, tourism is the key sector. However, in countries such as Dominica and Guyana, the contribution to GDP from the agriculture, forestry, and fishing sector is higher with contributions of 13 and 17.6 per cent, respectively.
Almost all the Caribbean Islands states import over 60 per cent of the food they consume. The SIDs are riddled with challenges resulting from poor nutrition with one-third of adults in the Caribbean SIDs being obese.[2]
4.1.2 Canada
Canada is a higher-income economy with a per capita GDP of $ 46,194.73 as of 2019. The agriculture, forestry and fishing sector contribute 1.9 per cent to the Canadian GDP and employs 1.5 per cent of the population. Arable land takes 4.3 per cent of the total land area. Agriculture in Canada is mostly practiced commercially on a large scale. Whereas only 4.3 per cent of Canada’s land mostly in the western part of the country is arable, the country has significant agricultural export volumes and has a booming market size for agricultural and agri-foods products. After the European Union, USA, Brazil, and China, Canada is the fifth largest exporter of agricultural and agri-food products in the world, with the country exporting over a half of what they produce. The country exports approximately US $56 billion worth of agricultural and agri-food products annually.[3]
4.2 Systemic constraints to agriculture in Commonwealth Caribbean SIDS
4.2.1 Climate vulnerability and agriculture productivity
To show the level of vulnerability to climate shocks and readiness to respond to these shocks, the ND-GAIN Matrix is used. The Matrix provides a visual tool for quickly comparing the current state of climate vulnerability and readiness of different countries.
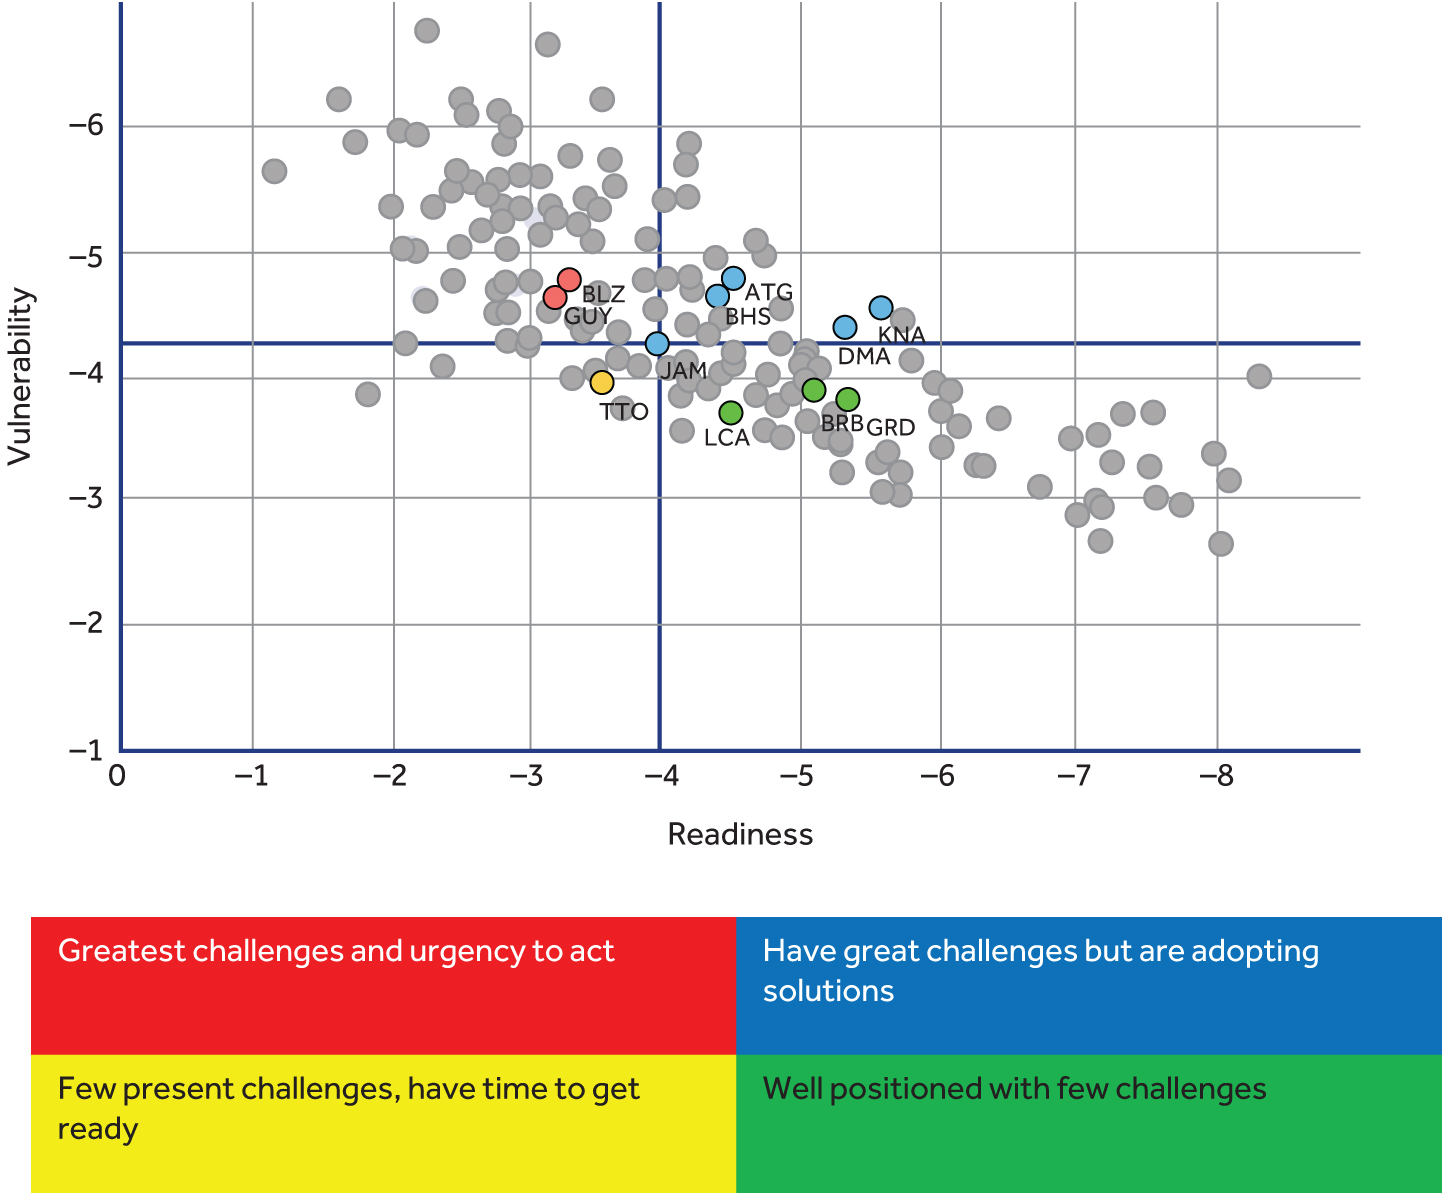
Source: Notre Dame Global Adaption Index, 2017[4]
The Caribbean SIDS are one of the most vulnerable geographic regions in the world to the potential impacts of climate change. The regions do not have to wait to see the effects of climate change as events are already happening. There have been increasing occurrences of strong hurricanes, extreme rainfall events, storms, floods, extreme droughts, and rising sea levels among other changes.
Climate change in the region has had a direct impact on agriculture productivity because traditionally grown crop species are no longer relevant. Changes in climate events impact traditional agriculture practices. For example, farmers typically plant based on the knowledge that they have acquired and passed on for generations. However, due to climate change, farmers have to adapt to new crop species and ways of doing things as some traditional crops and the varieties they typically know how to grow are being impacted by climate change and are not resilient.
Beyond just having an impact on agriculture productivity, the rising sea levels are increasingly becoming a threat to coastal infrastructure and availability of agricultural land as more and more people are being forced to migrate inland. Furthermore, rising sea levels leave salt deposits in the soil and contaminants in the groundwater supply. This has a negative impact on freshwater available for agriculture and other activities, and this in turn has adverse effects on food security.
Use of Insurance in Caribbean Island Commonwealth Countries
A single catastrophic event usually affects large proportions of clients, and this is often reflected in the insurance premiums charged by local insurance companies, especially if they only underwrite risk in one or a few neighbouring islands (as is common in the Caribbean).
To be able to pay many claims all at once, insurers must either purchase their own insurance (re-insurance) which is expensive due to the high exposure to extreme weather events or hold a large amount of cash reserves. Therefore, crop insurance policies are relatively expensive and are generally offered as non-catastrophic policies that is to say, providing no coverage in the case of extreme weather events.
Nevertheless, some private lead insurance initiatives for farmers exist in the region. A key example to this regard is the Jamaican Local insurance provider GK Insurance, which through a partnership with Germany's Munich Climate Insurance Initiative implemented a Climate Risk Adaptation and Insurance product in the Caribbean in 2018.[5] This is the first time, a micro-insurance product designed to protect against loss of income due to weather events was implemented in Jamaica and the wider Caribbean.
4.2.2 Access to finance and investment
Climate vulnerability and exposure of the islands to external shocks and natural disasters have a direct impact on the ability of the agriculture sector to attract financing from both private and public options. Data on the Caribbean SIDS show that there is limited private sector to the agriculture sector. The average for 10 of the 12 Caribbean SIDS is 1.75 per cent as shown in Table 4.1.
Table 4.1: Proportion of private sector credit to agriculture
|
Proportion of private sector credit to agriculture (Caribbean SIDS) |
|
|
Antigua and Barbuda |
0.03% |
|
Barbados |
0.12% |
|
Belize |
8.56% |
|
Dominica |
0.12% |
|
Grenada |
1.30% |
|
Guyana |
6.77% |
|
Saint Lucia |
0.20% |
|
St Kitts and Nevis |
0.07% |
|
St Vincent and The Grenadines |
0.09% |
|
Trinidad and Tobago |
0.29% |
Source: FAOSTAT.[6]
The agriculture sector financing in the Caribbean SIDs is quite low compared to the sector’s contribution to GDP.
Table 4.2: Agriculture Orientation Index
|
Agriculture Orientation Index (share of credit provided to agriculture over the share of agriculture in GDP)
|
|
|
Grenada |
0.2 |
|
Guyana |
0.6 |
|
Jamaica |
0.3 |
|
Saint Lucia |
0.2 |
|
Trinidad and Tobago |
0.2 |
Source: UNSTAT.[7]
*Less than 1 – the agriculture sector receives a lower share of credit compared to its GDP share
*Greater than 1 – the sector receives a higher share of credit compared to its economic contribution.
Smallholders mostly depend on their own resources and loans from family and friends to sustain agriculture production. Some countries have set up National Development Banks to boost financing in the agricultural sector. However, these have not worked as envisaged because these banks tend to operate in most countries like commercial banks. These specific banks have not created the strategic advantage for stimulating financing to the agriculture sector. This is with the exception of Trinidad and Tobago where the bank is heavily subsidised by the state.
Lack of adequate financing in the region is a major hindrance to development of the agriculture and other sectors. Most Caribbean SIDS find it hard to mobilise concessionary funds because GNI per capita is used as a metric to determine the amount of concessionary funds that a county obtains. By this measure, most Caribbean SIDS are middle-income categories.
However, since Caribbean SIDS are highly vulnerable to natural hazards, incomes are very volatile. This makes the per capita GNI an unreliable basis for evaluating the need for international financial assistance. Vulnerability ought to have an additional criterion, or a discount factor applied in addition to the per capita GNI.
4.2.3 Market, trade and supply chain
The output of the sector in the region is dependent on seasons. As a result, there is a lack of consistency all-year round. This has resulted in a high dependency on imported foods because sectors like tourism need to have a steady and secure food supply. Caribbean SIDS import over 60 per cent of their food.[8]
High dependency on imported foods has resulted in high capital flight from the region. High import dependency is also driven by the following:
- Imported foods tend to be cheaper than local options.
- Local production cycles are not organised; that is to say, there is little to no collective action when it comes to production and marketing. Farmers prefer to find their own markets as opposed to practicing contract farming.
The small size and geographic isolation of SIDS pose challenges in transport and trade logistics. The Liner Shipping Connectivity Index (LSCI) is used to assess trade facilitation for SIDS. The LSCI aims at capturing the level of integration into the existing liner shipping network. The LSCI can be considered an accessibility proxy to global trade. A higher index means that it is easier to access high frequency and larger capacity global maritime freight transport systems. It also means a greater capacity to effectively participate in international trade.[9]
Table 4.3: The Liner Shipping Connectivity Index
|
The Liner Shipping Connectivity Index (captures the level of integration into the existing liner shipping network by measuring liner shipping connectivity) |
|
|
Caribbean SIDS |
|
|
Antigua and Barbuda |
5 |
|
Bahamas, The |
N.A |
|
Barbados |
8 |
|
Belize |
8 |
|
Dominica |
6 |
|
Grenada |
6 |
|
Guyana |
8 |
|
Jamaica |
36 |
|
Saint Lucia |
6 |
|
St Kitts and Nevis |
N.A |
|
St Vincent and The Grenadines |
N.A |
|
Trinidad and Tobago |
15 |
Source: UNCTAD maritime connectivity indicators.[10]
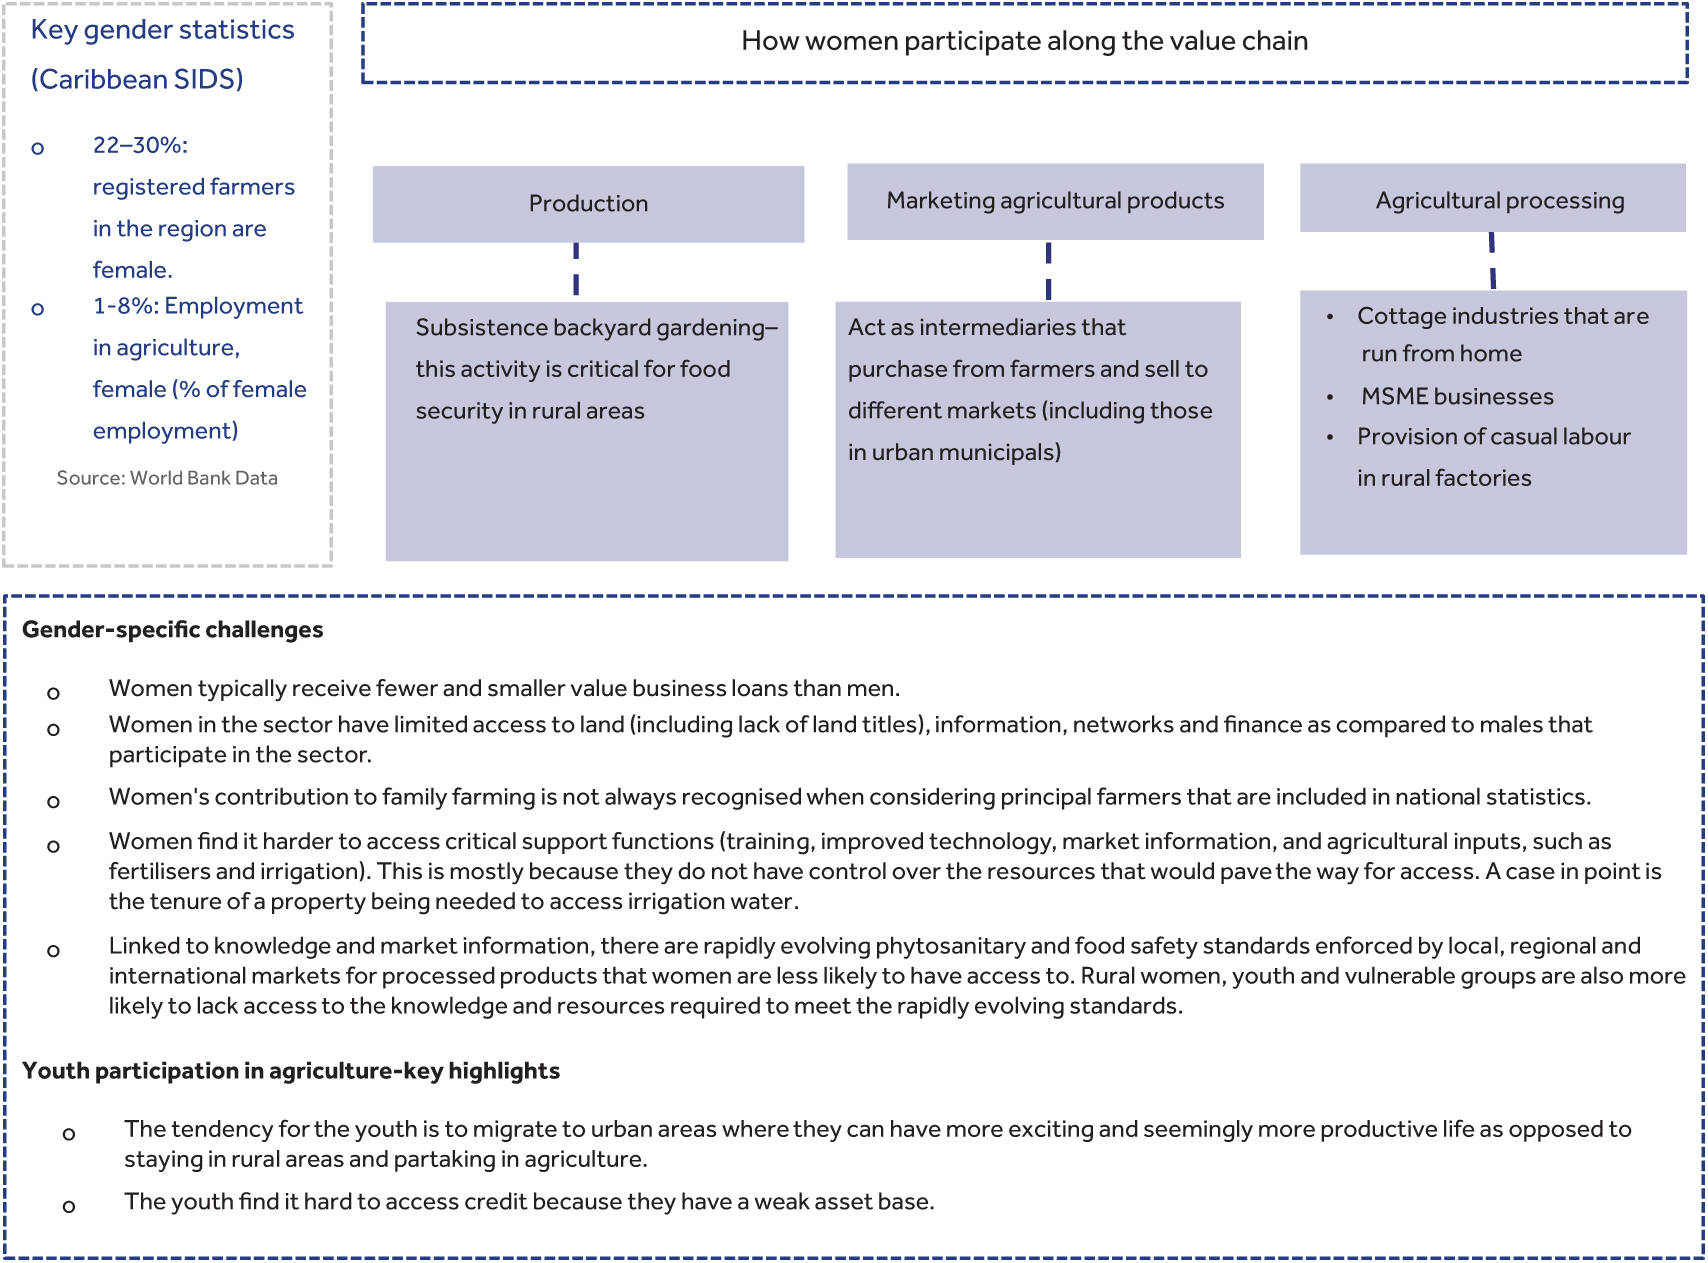
4.2.4 Inclusion of women and youth in agriculture
Case study: Impact of the Covid-19 pandemic on the agriculture sector in Commonwealth Caribbean and Americas
Impact of the COVID-19 Pandemic
Caribbean SIDS
- Reduced total consumption: Global restrictions on international travel hit the tourism-driven SIDS leading to reduced demand for food items. In Jamaica for example, the hotel, restaurant and institutional sector that constitutes 60 per cent of food imports was grossly disrupted by the pandemic.
- Import of food and agricultural inputs in the SIDS was heavily affected by global restrictions on freight forcing the island nations who import 80 per cent of their food to depend on domestic produce.
- The fisheries sector which contributes 3 per cent to the GDP of SIDS[11] was severely affected by the global decreased demand for fish during the pandemic.
Canada
- Backlog at slaughterhouses[12]:
- Beef: In April 2020, following the COVID 19 outbreak at Cargill Ltd. facility in High River, Alta., and a JBS Canada plant in Brooks, Alta, two of Canada’s largest slaughter facilities, which account for 70 per cent of the country’s beef slaughter capacity, led to a backlog of over 100,000 heads of cattle.
- Pork: In March 2020, the closure of two pork processing plants due to the outbreak of COVID-19 at the facilities also contributed to a backlog of approximately 150,000 heads.
- Reduced demand: The closure of sectors such as the restaurant industry resulted in reduced demand for agro-products. Diversion of this supply to retail stores resulted in market saturation and a tank in prices. The dairy, broiler and eggs markets were particularly hit by this phenomenon.
- Labour shortage: Canada’s horticultural sector that relies on foreign labour especially during harvests was affected by lockdown restrictions particularly emanating from the halt in the inflows of temporary foreign workers.
Responses in light of COVID-19 Outbreak
Caribbean SIDS
Government policy initiatives
- Some SIDs Governments have embarked on the provision of relief funding to the agricultural sector to help farmers cope with the aftermath of the pandemic. For example, the Jamaican Government has allocated up to US $6.8 million to the agricultural sector.
- The Ministry of Agriculture in Guyana is providing special incentives for investment in corn and soybean in a bid to resuscitate the agricultural sector following the pandemic.[13]
- In Trinidad and Tobago, the Government provided food card support of $510.00 per month for three months for households where a family member was retrenched, terminated or had their incomes reduced. This ensured the continued demand for agricultural produce.[14]
- The Jamaica Agricultural Commodities Regulatory Authority (JACRA) announced a reduction of export fees by 50 per cent for commodities such as coffee, cocoa and spices.[15]
Canada
Agriculture Response Program[16]
- The programme was designed to help Canada’s Nova Scotia state’s agricultural sector to circumnavigate the COVID-19 fallout. The target beneficiaries of this programme include farmers, agribusinesses and agricultural industry associations. The programme helped beneficiaries to cope with the costs of complying with set health protocols in light of COVID-19 by providing up to 50 per cent payment of the associated cost with a maximum of US$ 30,000.
Government facilitation to off-set costs of quarantining
The Canadian Government provided approximately 65 million Canadian Dollars to offset the costs associated with mandatory quarantine of temporary foreign workers in a bid to alleviate the labour shortage in the fruits and vegetables sector.
4.3 The state of digital agriculture in Caribbean SIDS
4.3.1 Digital innovations for digitalisation of agriculture in the Caribbean SIDS
Many digital agriculture solutions in the region are not publicly documented. Eleven digital agriculture solutions were purposively sampled. These included the following:
- The Belize Agriculture Information Management System in Belize
- Agri links Belize in Belize
- Farm Connect in Jamaica
- Farmgate-emarket in Jamaica,
- Farmcredibly in Jamaica
- The Jamaica Agricultural Marketing Information System
- CAC Jamaica App
- Namdevco in Trinidad and Tobago
- Dmarketmovers in Trinidad and Tobago
- Whyfarmit in Trinidad and Tobago
- Akatafarms in Grenada.
Summary of findings from the mapping process is shown below.
|
Four (4) of the eleven (11) digital agriculture solutions are provided by Government and focus on the provision of market linkages. The specific solutions are the Belize Agriculture Information Management System, the CAC Jamaica application, the Jamaica Agricultural Marketing Information System and Namdevco) |
|
Even though the share of credit provided to agriculture over the share of agriculture GDP in the region is less than 1 per cent, only one (1) of the eleven (11) profile solutions, farmcredibly, provides financing to the farmers in the region[17] |
|
Even though the Caribbean SIDS (Small Island Developing States) are very vulnerable to the impacts of climate, none of the profiled solutions seeks to mitigate the damages that accrue from the increased vulnerability of the agriculture sector to climate change |
|
All 11 profiled digital solutions have websites as their primary delivery medium |
Drones, IOT and other smart farming implements
While there are few notable use cases of smart farming, such as Proximal Soil Sensing[18]in Trinidad and Tobago, there is a void of literature that documents the size of the roll-out in the region and the specific length of time such events have occurred.
Case study: Featured frontier digital agriculture solution in the Caribbean – Farmcredibly in Jamaica
With less than five (5) per cent of formal loan portfolios in the Caribbean going to agriculture and a lot of land being held collectively by families, most smallholder farmers in the region have no access to formal credit.[19] Digital solutions have opportunities to use person and environmental data to provide alternative means of credit scoring for farmers in the region. Farmcredibly is a frontier solution in Jamaica working to solve this problem. Farmcredibly is an Agri-tech solution provider in Jamaica that leverages blockchain technology to enable rural farmers to build profiles that are later used to create lucrative relationships between farmers and lenders like Banks, Agri-processing entities, and farm produce dealers.
Companies and individuals that rely on sourcing from farmers or connect with various clusters of consumers use the farm credibly platform data to participate effectively in supply chains by making data-driven decisions regarding their interaction with the farmers in their various value chains. In addition, the solution provides an alternative to lending to farmers, which is not reliant on the traditional collateral that is usually in the form of land and other physical farm assets.[20]
Value proposition summary
- Alternative credit scoring for farmers in Jamaica.
- Enables banks to expand their lending portfolios to farmers and agribusiness entities.
- Builds and documents farmer credit profiles.
- Enables farmers to access farm produce distributers based on their produce data history.
- Enables farmers to build long-term relationships with agri-processors.
Product offering details
General outreach – Like many farmers in the region, most of the farmers in Jamaica are largely unbanked. In Jamaica, an estimated 90 per cent of farmers in the region are underbanked and cannot access capital to finance their farms. While this is largely due to the absence of physical collateral, which causes formal lending institutions to consider these smallholder farmers as largely risky, farmcredibly is changing this providing a data-driven alternative to credit scoring.
Use of farmer data to enhance farmer credit profiles – Since its establishment in 2017, the Farmcredibly has ultimately simplified financial services for underbanked farmers who are productive, and typically on small land parcels of less than two hectares but want to be more productive. The solution brings together multiple entities within farmers’ business networks ranging from farm input distributors, lenders and agri-processors on behalf of farmers.
Farmcredibly also empowers lenders with the means to reduce risk in issuing loans and micro-investments to underbanked farmers by leveraging Blockchain technology to provide alternative credit scoring. The solution also provides a trusted and secure farmer profile is established based on existing farm investment, past transactions (farm also expenses and income), any amounts owed and the farmer's years of experience. Farmcredibly enables banks to expand their agricultural lending to farmers and agribusinesses by automating the credit assessment process. By providing an efficient and standardised scoring tool for agricultural loans, banks can reduce reliance on loan officers who may have limited knowledge of Agriculture.
Farmer success story: Featured frontier digital agriculture solution in The Caribbean – Farmcredibly In Jamaica[21]
Kevin Buchanan is one of the direct beneficiary farmers in Jamaica that have gotten alternative credit scores from farmcredibly on the basis of his farming experience, acreage and crop type. Kevin has been able to raise more than 2,455,327 Jamaican dollars he has used to expand his farm in invest in the commercial production of hot peppers on additional acres of land. With over 20 years of experience in large-scale farm management, Kevin finally has the chance to invest his time in his land.
Farmcredibly is focused on solving global problems but also problems that are widespread in the Caribbean. Agriculture is intertwined in the history of most Caribbean countries, and globally over 1 billion people are employed in agriculture, representing one in three of all workers: access to markets and access to finance. Farm Credibly has decided to focus on access to finance using market research as a starting point to unlock financing for farmers like Kevin in the Caribbean. Key insights used in the provision of the service were gained from participating in and winning an IBM/NCB-sponsored Blockchain hackathon allowed FarmCredibly to start thinking about problems related to financial inclusion from the point of view of lenders and creditors.
It is often difficult for banks to determine which farms are productive and can be more productive with access to capital. Pepper farmers for example have difficulty accessing funds to produce scotch bonnet and west Indian red peppers despite the unmet demand from agro-processors to produce pepper mash in the region. Daphne Ewing-Chow, Senior Contributor at Forbes details that “less than 2 per cent of Jamaica’s commercial lending portfolio is allocated to agriculture (Bank of Jamaica) with less than 10 per cent of Jamaican farmers having access to credit. (Jamaica’s National Financial Inclusion Strategy, 2016–2020)” The current agricultural landscape provides an opportunity that has allowed FarmCredibly to open the possibility for new methods of assessing managing risk to create new financial tools for farmers in Jamaica.
FarmCredibly simplifies financial services for underbanked farmers who are productive but want to be more productive. We bring together multiple entities within farmers’ business networks on behalf of farmers. FarmCredibly empowers lenders with the means to reduce risk in issuing loans and micro-investments to underbanked farmers by leveraging Blockchain technology to provide alternative credit scoring means. Farm Credibly enables banks to expand their agricultural lending to farmers and agribusinesses by automating the credit assessment process.
4.3.2 Data infrastructure for digitalisation of agriculture in the Caribbean SIDS
Data for content
Soil and weather data: While all the Commonwealth Caribbean SIDS have Government provided entities that collect weather data, none of them distribute this data using public and open Application Programming Interfaces (APIs). Furthermore, while the study did not profile any state-provided soil testing service in any of the Caribbean SIDS, data about each of the country’s soil attributes is freely available in the Soil and Terrain Database (SOTER) for Latin America and the Caribbean (SOTERLAC) run by the International Soil Reference and Information Centre.[22]
National Agri-statistical data: National agri-statistical data in the Caribbean SIDS is largely non-existent. Except for Belize, the study did not profile any other Commonwealth countries that have carried out a national agriculture sector census since 2010. Additionally, few organisations collect agriculture sector data for public and open-source use. Despite the above, momentum has been steadily building among key stakeholders in the region, with agriculture becoming the focus of many early initiatives. Notable examples include open surveys in the region, for example, the Caribbean COVID-19 Food Security & Livelihoods Impact Survey by the World Food Programme in 2020.[23]
Farm-level yield data: Many farmers do not keep records and do not know the financial state of their enterprise. They blame the low incomes, high input costs and general production and marketing challenges in the system for the disinterest in adopting a business approach to agriculture.[24]
User identifiers
Primary identifiers for farmers: While each of the Commonwealth countries in the Caribbean SIDS has state-issued national identifiers, there is a general absence of publicly available data about the penetration of national identity schemes in the region. Except for Dominica, Guyana and St Kitts and Nevis, all the Commonwealth member countries in the Caribbean have national farmer registries. However, the various variables collected and intersectoral relationships with other state-managed registries remain largely unclear. In addition, none of the state-managed farmer registries publicly avails the number of farmers that have been profiled.
Primary identifiers for farmer land: From the deep dive done, there is a void of literature that documents the exact portions of farmland that is formally registered. Land administration systems in the region generally lag behind the rapid development of land markets. Robust land information systems are needed to provide a comprehensive formalisation of land use rights.[25]
4.3.3 Business development services for digitalisation of agriculture in the Caribbean SIDS
There is a lack of authoritative data that documents the flow of funding to different digital solutions in the region. From the limited literature, digital agriculture solutions in the region come from a mix of state funding, private funding and revenue from technology competitions. State-financed digital agricultural solutions in the region include the Belize Agriculture Information Management System and Namdevco in Trinidad and Tobago. An example of digital solutions in the region gaining funding from technology competitions is Farm Credibly that won the pitch AgriHack[26] competitions in 2018.
4.3.4 Enabling environment for digitalisation of agriculture in the Caribbean SIDS
Technology-related enablers of the digitalisation of agriculture
1. Availability of network coverage and internet access: The proportion of people using the internet in the Caribbean SIDS varies from as low as 21 per cent in St Vincent and The Grenadines to as high as 85 per cent in The Bahamas, 82 per cent in Barbados and 81 per cent in St Kitts and Nevis.
Table 4.4: Individuals using the internet (% of population)
|
Individuals using the internet (% of population) |
|
|
Antigua and Barbuda |
73 |
|
Bahamas, The |
85 |
|
Barbados |
82 |
|
Belize |
47 |
|
Dominica |
70 |
|
Grenada |
59 |
|
Guyana |
37 |
|
Jamaica |
55 |
|
Saint Lucia |
51 |
|
St Kitts and Nevis |
81 |
|
St Vincent and The Grenadines |
21 |
|
Trinidad and Tobago |
77 |
Source: Author computations from the World Bank indicator database.[27]
The current state of the necessary infrastructure for internet connectivity is discussed as follows:
International connectivity. Satellite connections have historically been the only way for island nations in the Caribbean SIDS to gain access to international connectivity. However, the high costs of satellite internet connections and higher bandwidth requirements are prompting a shift from satellite connections to submarine cabling. In fact, submarine cabling is now the most widely deployed technology in the Caribbean SIDS for international connectivity. All the Commonwealth countries in the region have at least two submarine connection cables. This is good because it provides backup options if one of the cables becomes inactive. Additionally, since the cables are typically run by competing entities, competition has the potential to drive down pricing.[28]
Inter-regional connectivity. Microwave connections, though to a less degree, are used to supplement the satellite and sub-marine cable primarily as backup links, particularly between islands within proximity. In multi-island countries like Trinidad and Tobago, microwave networks are the medium of choice to link islands, where submarine fibre has not yet been deployed.
Wireless broadband penetration. In the Caribbean, internet services are delivered in-country via a combination of fibre-optic, coaxial and copper cables, and mobile wireless networks. As of 2017, 2G mobile/cellular networks were the main form of wireless broadband coverage covering most of the population. There was also increasing penetration of newer third-generation (3G), 4G and long-term evolution mobile technologies that support mobile broadband internet being deployed. The density of fixed broadband subscribers is generally low – from less than four subscriptions per 100 inhabitants in the Bahamas to 27 subscriptions per 100 inhabitants in Barbados in 2014. As of 2016, the coverage gap in the Caribbean SIDS was relatively small, with only about 10 per cent of the population living outside the footprint of 3G or 4G networks. Such high levels of mobile broadband coverage create a vast opportunity for the distribution of developed mobile solutions using the internet to a wider audience.[29]
2. Mobile penetration: Mobile penetration in the Caribbean SIDS is high. Over the past decade, smartphones in the region have become increasingly available at a broad range of price points and have become the most common means by which the population accesses the internet. As a result, carriers appear to be aggressively promoting their mobile data services by offering a wide variety of plans, particularly to prepaid consumers.
Mobile cellular subscriptions (per 100 people) for the Caribbean SIDS is shown below.
Table 4.5: Mobile cellular subscriptions (per 100 people)
|
Mobile cellular subscriptions (per 100 people) |
|
|
Antigua and Barbuda |
192.82 |
|
The Bahamas |
109.25 |
|
Barbados |
114.74 |
|
Belize |
65.30 |
|
Canada |
91.86 |
|
Dominica |
105.79 |
|
Grenada |
104.24 |
|
Guyana |
82.97 |
|
Jamaica |
102.56 |
|
Saint Lucia |
101.68 |
|
St Kitts and Nevis |
147.71 |
|
St Vincent and The Grenadines |
92.87 |
|
Trinidad and Tobago |
155.11 |
Source: Author computations from the World Bank indicator database.[30]
Non-technology-related barriers to the digitalisation of agriculture
1. Relatively small island populations: The Caribbean region is characterised by a small market, which limits a potential start-up’s revenues and therefore its sustainability. Despite this, local markets have the potential to be a testing ground for developments, if Government support is provided.
2. Inadequate level of innovation financing: There is an inadequate level of seed financing. Except for the Entrepreneurship Program for Innovation in the Caribbean (EPIC), there has been no notable financing for digital agriculture innovation in the region. This significantly slows down the rate of innovation in the digital agricultural space.
3. Topographical constraints: Remoteness of many of the Caribbean SIDS makes the cost of internet cable connections between islands countries very high. It also increases the capital expenditure of the mobile network operators and consequently causes the cost of mobile broadband connections to become prohibitively high.
4. Limited collaboration among innovation communities: There is limited collaboration between mobile innovation communities from different islands in the Caribbean.[31] This is a barrier because collaboration is necessary for start-up ecosystems to thrive. This slows down the development of relevant and affordable digital agricultural solutions. There is also a lack of mentors and role models who can pass their industry knowledge onto aspiring solution developers and that slows down digital agricultural innovations in the region.
5. A lack of basic digital literacy in the Caribbean: Although basic literacy rates in the Caribbean are higher than the global average, there remains a gap in digital literacy and skills.[32] Insufficient infrastructure and teaching support for digital education prevents many mobile users from exploring the benefits of the internet. Having low levels of digital literacy effectively lowers the ability of the literate population to use digital solutions in the most effective way. This is because users with low levels of digital literacy may not be able to effectively deal with the primary access mediums for the consumption of digital solutions like smartphones and computers.
Source: Author computations from the World Bank indicator database.
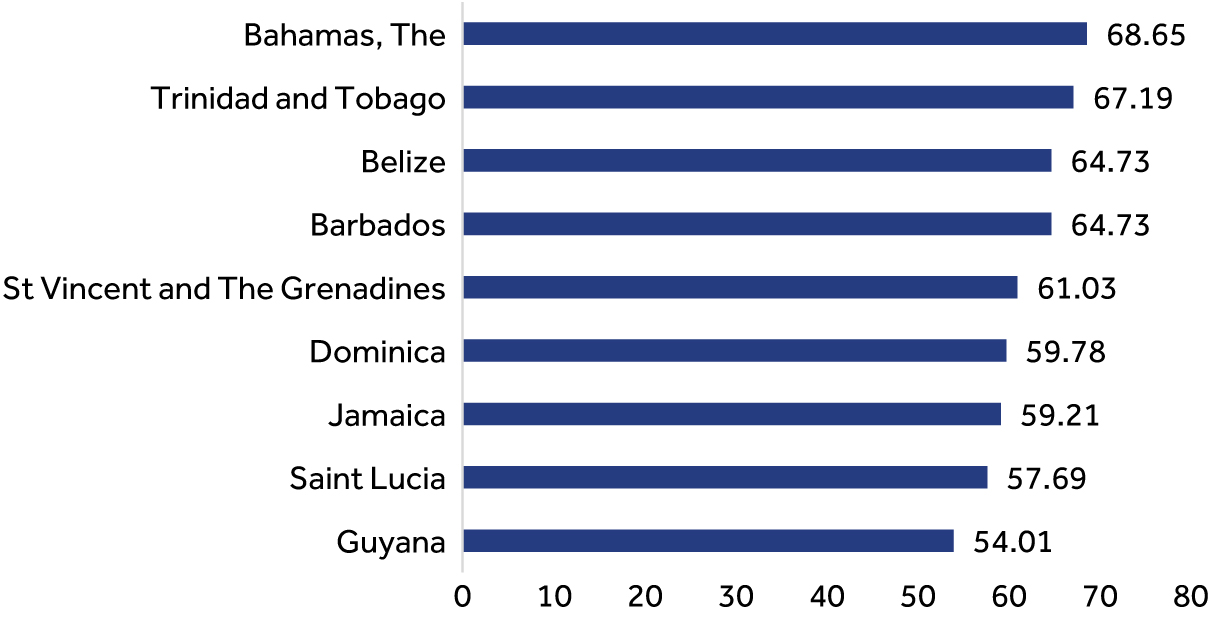
To better understand the enabling environment for digitalisation in the Caribbean Island states, this section uses the GSMA mobile connectivity index.[33] This quantitative measure reveals that most of the countries in the region have GSMA connectivity indices higher than 60, unlike their counterparts in Africa and Asia, which is generally representative of a more enabling environment for digitalisation. As shown by the figure on the right. It should also be noted that the island countries of Antigua and Barbuda, Grenada, St Kitts and Nevis in the region had no GSMA index data.
This index has been explained in detail in both the annex and footnote.
4.4 Policy recommendations to fast-track digitalisation of agriculture in Caribbean SIDS
4.4.1 Digital innovations
Gaps (factors limiting innovation and scalability in digital agriculture)
- Limited investments by private sector actors in digital innovations. The limitation in investment is from both the private and public sector and from international players.
- The region is characterised by a few digital solution service providers.
Table 4.6: Recommendation for Caribbean SIDS to increase investment in digital agriculture innovations
|
A. Use Support Measures to provide support to actors in the sector that have potential to promote (champion) investments that are building the rails for digitalisation of agriculture |
Real-world examples where the suggested measures have been used |
|
A.1 Reduction in mobile-specific data tax rates |
The United Kingdom – The United Kingdom introduced an R&D tax credit scheme in 2000 in order to provide better Government funding for R&D in small- and medium-sized businesses. A recent econometric analysis by the UK Treasury concludes that recipient companies in total spend twice the amount they receive in R &D tax credits on actual product development and design[34] |
|
A.3 Tax incentives for software development services, ICT-related services, data processing services
|
|
|
A.4 Provide R&D support, including R&D incentives, funding for basic research and R&D grants.
|
Bangladesh[35] – The Government of Bangladesh partnered with UNDP to finance a digital solution that would close the agriculture extension gap using the “Krishok Bondhu Phone Seba” mobile platform. The Government directly financed the research and development of the solution that profit-centric private sector entities were not able to fund. This solution has since closed the extension gap for an estimated 22 million smallholder farmers in the country |
4.4.2 Data infrastructure
Gaps in the data infrastructure required for digitalisation of agriculture in the Caribbean SIDS to thrive
In the Caribbean, most of the Governments have national identifications and collect and distribute weather data. However, there is still a significant gap in the use of farmer and farm biosphere data in the existent digital solutions in the region. Some of these gaps include:
- Absence of robust national agri-statistical national data sets. Many of the countries in the region do not have national agri-statistical data infrastructure that would guide the adoption of formulated digital agricultural solutions to the needs of the population.
- Absence of state-run soil and weather data APIs. In the region, none of the state-run entities provide weather data in the form of open Application Programming Interfaces (APIs). Furthermore, none of the region’s governments have notable soil testing programmes.
- Absence of robust linkages between land and person identifiers. While there are national identifiers that are issued by governments in the region, many of the region’s governments have not yet created definitive links between the national identifiers and livestock, yield and soil identifiers.
Table 4.7: Recommendation for Caribbean SIDS to increase investment in data infrastructure
|
B. Boost investment in agricultural data infrastructure and its key enablers |
Real-world examples where the suggested measures have been used |
|
B.1 Investing in regular decennial Agricultural Census activities. |
Kenya – Every ten years, as advised by the Food and Agriculture Organisation of the United Nations (FAO), the Kenya Bureau of statistics executes a decennial agriculture Census and publicly avails the resultant datasets. This enables the country digital solution developers to customise their digital agriculture solutions such that they are in line with the demands of the farming population as revealed in the survey data[36] |
|
B.2 Investing in the distribution of unique person identifiers and creating interoperability among different identity systems |
India – The Indian Government has enrolled more |
|
B.3 Investing in the collection and distribution of soil and weather data from state entities |
India – The Indian national soil health care system that has been executed by the Indian Government has provided free soil testing and soil attribute documentation for farmers, which is a monumental first step on the path to ultimately documenting all farm attributes in order to avail this data in the development of data-centric applications. |
4.4.3 Business development services
Gaps (factors hindering the flow of financing to digital innovations in agriculture)
- Lack of adequate financing in the region is a major hindrance to the development of the agriculture and other sectors. Most Caribbean SIDS cannot mobilise concessionary funds because the GNI per capita that is used as a metric to determine the amount of concessionary funds that a country obtains classifies them as middle-income countries.
- Limited incentive for private sector investment in robust mobile network operations. Although most Caribbean countries have identified the internet as critical to their economic and social development and therefore a high priority for investment, the efforts to attract the needed investment have been limited in practice. Frequently, policy-makers appear to be of the view that investors are eager to enter their countries’ market and are prepared to pay the top price for the licenses being offered.
- Low state-provided expenditure on government research and development into smart farming. The Caribbean Government entities have low expenditure on the research and development of custom smart farming solutions for smallholder farmers in the region. As observed in regions like Sub-Saharan Africa and South Asia, in the absence of significant private sector expenditure in the research and development of digital solutions, this leaves a void of funding entities for the development and systematic roll-out of digital agriculture solutions in the region.
- Absence of country-level innovation hubs. Governments in the region have had minimal effort in the creation of state-run digital agriculture innovation hubs in the region. This has had a consequent negative effect in the creation of locally relevant digital solutions in the region that are home-grown and customised to the Caribbean island’s context.
Table 4.8: Recommendation for Caribbean SIDS to increase investment business development
|
C. Making Government led investments in critical areas where there is limited private sector investment |
Real-world examples where the suggested measures have been used |
|
C.1 Invest in public agricultural expenditure on digital agriculture R and D |
New Zealand[39] – The Government of New Zealand has undertaken robust investment in domestic agricultural R&D. The Government of New Zealand estimates that investment in domestic R&D has generated an annual rate of return of 17%. The results underscore the importance of state-provided R&D expenditure in the digital agriculture space |
4.4.4 Enabling environment
Gaps in the enabling environment required for digitalisation of agriculture to thrive
- Existence of a significant broadband coverage gap. Despite broadband extension efforts in the Caribbean, most areas in the islands are still uncovered by broadband connections. This is due to cost as coverage of some remote islands is particularly expensive.
- High cost of electricity due to reliance on fossil fuel energy. High electricity costs make the cost of powering cell sites very high. This consequently increases the cost of internet connections.
- Absence of policies that facilitate the growth of internet connectivity. Caribbean Governments have been largely responsive rather than proactive in nurturing the development of the internet to meet their countries’ needs.
Table 4.9: Recommendation for Caribbean SIDS to create an enabling environment for digitalisation to thrive
|
D. Make public infrastructure investments, either directly or in partnership with private investors |
Real-world examples where the suggested measures have been used |
Pillar/element that the suggested recommendation responds to |
|
D.1 Public–private partnerships. |
São Tomé & Principe – The small island nation of São Tomé & Principe in Africa successfully used PPPs to expand telecommunications infrastructure and reduce costs. |
Digital Innovations |
|
D.2 Effecting public–private partnerships to close the coverage gap in remote areas of some islands |
Australia – The Australian Government established a National Broadband Network that would build out fibre infrastructure to be made available to service providers on a wholesale basis. This is a very significant template for public–private partnerships that should be closely followed around the world. It reduces the cost of rolling out broadband connections especially in remote areas with small sparsely spread populations[41] |
Digital Innovations |
|
Make public infrastructure investments, either directly or in partnership with private investors |
Real-world examples where the suggested measures have been used |
Pillar/element that the suggested recommendation responds to |
|
D.3 Incentivise the use of technologies such as the Huawei rural star and the GEN CELL by mobile network operators to cover areas that have no broadband connections and no electricity grid coverage. |
Kenya and Ghana – The Rural star solution is the cost-effective deployment of rural coverage, specifically designed to provide 2G voice, SMS and mobile money services, and 3G broadband data Services. Huawei has demonstrated the impact of these services with a solution deployed in partnership with Safaricom to use, in remote rural towns in Kenya.[42] |
Digital Innovations |
|
D.4 Make public infrastructure in areas not targeted by private sector actors |
Rwanda – The Government of Rwanda and Korea Telecom (KT) entered into a public –private partnership (PPP) to deploy a wholesale LTE network in the country using 800-MHz and 1800-MHz spectrum. As a result, Rwanda has a 95% 4G LTE coverage. This would not have happened if the private sector entities have been left to make the coverage on their own, as they would have limited coverage to places, they deemed to be commercially viable[43] |
In conclusion, the most undeveloped element of the D4Ag structure in the region is the ‘base’ of an enabling environment. Access to affordable broadband in the region is still a major hindrance to the consumption of digital agricultural solutions. The high cost of deployment hinders the effective roll-out of telecommunications and internet infrastructure in the region. High costs arise from the topography of the region that increases the need for expensive sub-marine cable connections across island countries. Furthermore, due to small population sizes, competition in the telecommunications and internet-based sectors is likely to be limited, comprising either a single monopolistic player or a small handful of players.
Given all recommendations that have been made for the region, for the region to unlock the transformative potential of the digitalisation of agriculture, the following are necessary:
- Addressing the connectivity gap will require collaboration between players from across the mobile ecosystem, as well as a supportive regulatory and policy environment that encourages investment and innovation. Several bodies including the World Bank and the GSMA already echo the importance of collaboration and harmonisation in various areas of both telecoms and broader telecommunication regulation.
- Capacity building at a policy level is required. Capacity building of key decision-makers is necessary to empower them to make rules and regulations that are responsive to the fast-paced nature of technology innovations. Capacity building could be through the following:
- Facilitating benchmark visits to other Commonwealth countries where laws on technology are updated.
- Working with capacity-building partners who would carry out a capacity gap assessment and thereafter develop targeted capacity-building programmes.
- Identification of a capacity-building partner to develop and roll out the relevant programmes.
- There is a need to use an integral programming approach that involves different ministries as opposed to using only the ICT ministry.
4.5 The state of digital agriculture in Canada
Canada is assessed separately because it is the only country in the only Commonwealth country in North America. Additionally, Canada differs from the Caribbean SIDS in terms of Gross National Income, adoption levels of digital agriculture solutions and use of smart farming methods. As with other countries with high per capita gross national incomes, farming is done on a much larger scale for commercial and not subsistence reasons.
4.5.1 Digital innovations for digitalisation of agriculture in Canada
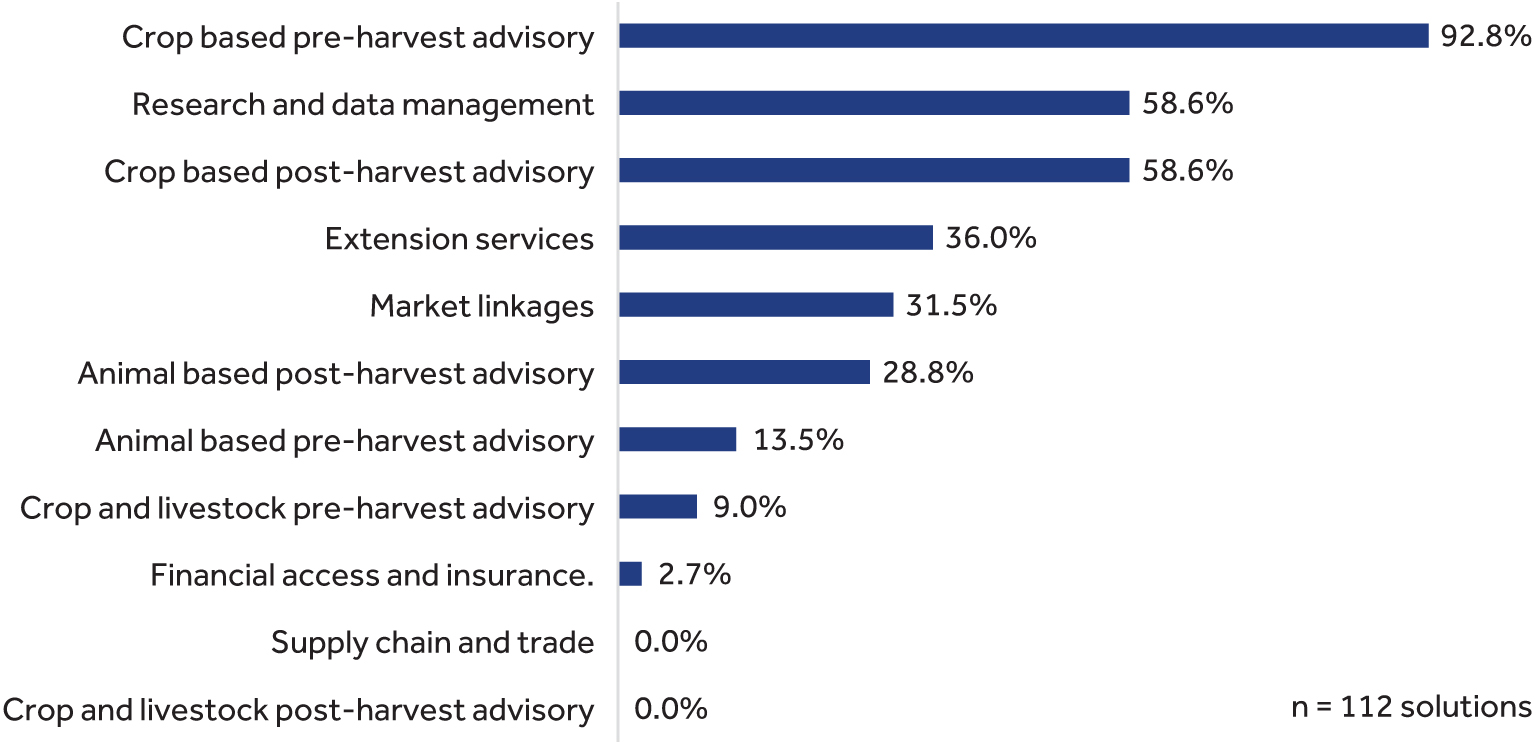
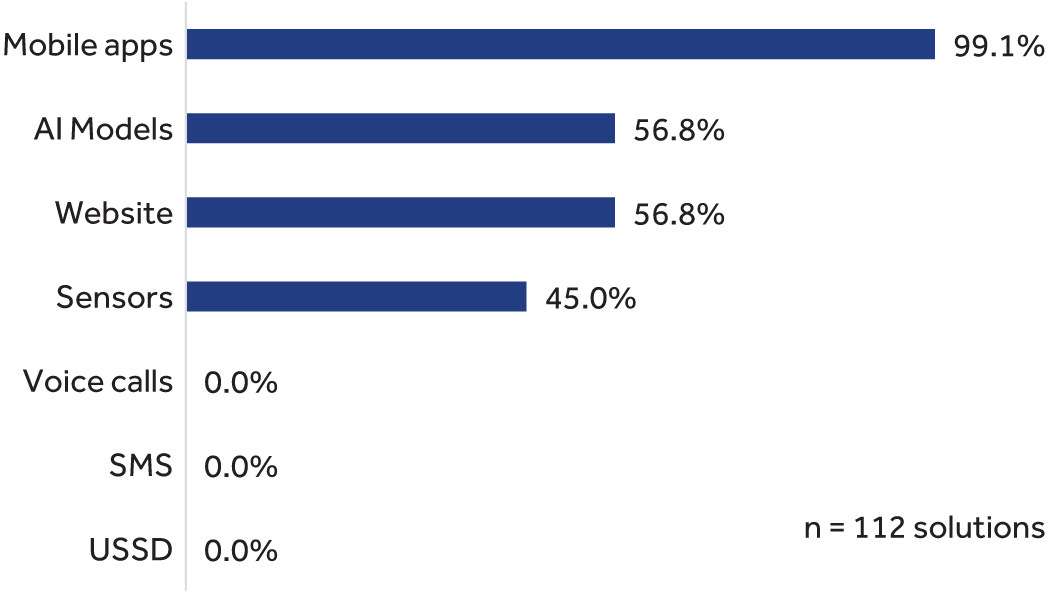
The study assessed 112 purposively sampled digital agriculture solutions. The assessed spectrum of solutions included mobile, desktop, web applications and smart farming offerings such as aerial crop monitors and other IOT smart farming offerings.
Use cases of digital agriculture solutions in Canada
Characteristics of digital agriculture solutions in Canada
- Ninety-two per cent of digital solutions in the sample provide some form of crop-based pre-harvest advisory in their value offering. This large number could be explained by the fact that many digital agricultural solutions in the country are smart farming based and work directly with field placed sensors to provide some variant of crop or animal monitoring service.
- Unlike other regions in the Commonwealth, research and data management solutions, as a use case, make up more than half the sampled set of solutions (58 per cent). This trend was equally observed in Australia and New Zealand.
- Eighty-one per cent of the solutions are privately run.
- Seven per cent of the solutions in the sample have more than two solution offerings in their value propositions. This is contrary to the assessed sets of solutions in Sub-Saharan Africa and Asian Commonwealth countries that were predominantly made up of solutions with two solution offerings and less. This finding underpins the narrative that adoption of digital agriculture solutions is higher when digital solutions have a more bundled product offering.[44]
Case study: Featured frontier digital agricultural solution in Canada – Semios Canada
Semios Vancouver offers a smart farming platform that provides real-time crop data and pest management tools for growers of tree fruit, nut and vine crops. The platform leverages a proprietary, Internet of things (IoT) wireless network, machine learning and big data analytics. The platform is installed on the farms to help farmers manage insect pests, disease, frost and irrigation. The Semios platform engine draws on a diverse range of sources of data and information including a robust, wireless network of IoT sensors on each customer’s farm measuring climate, soil moisture, insect and disease activity. Semios collects sensory data on every acre in near real-time, helping farmers manage the complex biosystems in orchards to optimise the sustainability and profitability of their crops.[45]
Value proposition summary
- Automated camera traps, spray timing tools, and variable rate mating disruption that is customised to unique pest behaviour.
- Insight into the in-canopy climate conditions faced by crops and powerful forecasts.
- Planning and monitoring irrigation schedules. These enable cost-effective utilisation of water sources.
- A scouting tool that enables the centralised storage of farm observation data during crop activities.
Product offering details
General outreach – Since its founding in 2009, the Semios IoT network has grown to become, the largest in agriculture on the North American Continent. The solution provides critical insights into the relationships between organisms and their environments, leveraging big data, machine learning and artificial intelligence. Semios aims to amplify the experience and confidence of farmers by providing a clear picture of how environmental and agronomic factors influence the yield and grade of their crops.
Data-driven approach to weather, pest and water resource management – Semios provides an integrated pest management solution, which uses machine learning to determine the most effective period for the application of pheromones to target specific pests. The solution enables the farmers to reduce expenditure on pheromones by ensuring targeted application only during periods when specific pets are active. The solution also provides microclimate predictions to farmers based on the locations of farms to ensure that farm activities such as the application of pheromones and other farm inputs are timed to occur during periods when the weather would not disrupt their effective application.
Farmer impact – Since being founded by Dr. Michael Gilbert in 2009, Semios has grown to a technology entity helping farmers in Canada manage more than 150,000 acres of permanent crops. It reaches also extends to over 500 farms in the United States. Its in-field data and control systems make it simpler and more efficient for growers to adopt technology to address their most pressing problems in crop production. Its sensors collect data on every acre in near real-time, helping farmers manage the complex biosystems in orchards to optimise the sustainability and profitability of their crops. Its cloud-based analytics platform ingests highly granular data from over one million IoT sensors in the field, measuring in-canopy microclimate, soil and plant conditions every 10 minutes. The 350 million data points collected daily feed established and proprietary models that provide guidance to improve agricultural practices addressing weather, insects, disease and water management challenges.
Farmer success story: Featured frontier digital agriculture solution in the Caribbean – Semios Canada
Bill Ward an almond Orchard farmer running BB Limited Almond Orchard company is one of the beneficiaries of the Semios data-centric pest and farm resource management software. Bill’s Almond farm spans a total of about 2,000 acres. He uses Semios’ pheromones hardware and software solution to manage the complex farm biosphere in his Orchard without the use of pesticides. Typically, pests on search large scale orchards pests are dealt with by use of indiscriminate spraying of pesticides. The Semios solution in addition to real-time monitoring allows the farmers like Bill to deal with pests on the farm without using chemicals to alter their farm’s natural environments.
Having adequate bees in place is essential for good pollination. In addition, ensuring chemical applications are timed to limit the impact to the bees is critical to ensuring a healthy farm biosphere. The Semios pollination tools factor in the farmer’s unique in-canopy conditions including temperature, wind and rain to help the farmers track how many bee hours they have accumulated on their orchards. The tool also forecasts when the bees will be active.
The Semios tools hence allows farmers to appropriately time sprays around bees. Semios weather stations and pheromone dispensers track temperature, barometric pressure and humidity every ten minutes giving customers accurate insight into their orchard's climatic conditions – right down to the acre. Semios users can view current and predicted bee active hours based on their in-canopy conditions on the pollination dashboard available on their web applications.
Drones, IOT and other smart farming implements
Smart farming typically involves the use of various forms of hardware and software to monitor the growth of plants and their interaction with the environment. Its hardware typically involves sensors mounted in various locations. These vary from sensors planted in the soil, right up to the sensors placed on UAVs (drones). Based on a survey in 2006,[46] in Canada, an estimated 23.2 per cent of farms use GPS equipment or products, 77.9 per cent use guidance systems, 23.5 per cent use variable-rate fertiliser application and 27.4 per cent use variable-rate pesticide application. This on average means that more than 75 per cent of all Canadian farming operations use at least one form of smart farming technology.
A possible explanation of this trend could be the introduction and bundling of digital solution sales with agricultural equipment sales. In this system, digital technologies are bundled with farm equipment purchases by agricultural technology vendors who leverage historical brand loyalty to sell digital solutions. As a result of the agricultural landscape in Canada being historically mechanised, the product bundling strategy automatically causes most farm mechanisation consumers in the market to automatically become digital solution consumers as well. While the source population from which this type of venture emerges is relatively small, they each control a sizable share of the market. There are three main groups of technology providers in the North American region with the scale, reach and commercial interest to coordinate and exploit the digital opportunities in agriculture. These include global seed and agrichemical sector companies, large global grain traders with sway on the export logistics and farm machinery manufacturers suppliers with the lion's share of the tractor and combine market.
4.5.2 Data infrastructure for digitalisation of agriculture in Canada
Data for content
Soil attribute data: The Canadian Government leverages the Soil Moisture and Ocean Salinity (SMOS) data (provided by the European Space Agency) via a mobile application. This application presents the volumetric soil moisture (percent saturated soil) for the soil surface layer. This data is curated on a regular basis, with daily and monthly updates.[47] In addition, the Canadian Soil Information Service maintains an updated soil information database that is nationally representative. The soil order is the highest level (broadest grouping) within the Canadian System of Soil Classification. Soils classified at the order level reflect the climate and landscape characteristics associated with the different regions of Canada.[48]
Weather data: The Canadian Centre for Climate Services freely provides weather and air quality data that includes both historical accounts of the data and weather forecasts. In addition, this weather data is distributed by Government-run Application Programming Interfaces (API). This could be best explained by the fact that Governments have both the means to shoulder the cost and technical capacity to implement the new delivery means.
User identifiers
National agri-statistical data: Canada is one of the Commonwealth member countries with a robust agri-statistical system. The Canadian Government conducts an agricultural census every 5 years. The most recent agricultural census done in Canada was done in 2021, with the anticipated release of findings scheduled for May 2022. The national agri-statistical data is collected at national, provincial and sub-provincial levels. The nature of the data collected includes the number of farms and farm operators, farm area, business operating arrangements, land management practices, livestock inventories, crop area, total operating expenses and receipts, farm capital and farm machinery and equipment.[49]
Farm-level yield data: Twenty-six per cent of the Canadian farming entities are registered as business entities. In addition, many Canadian farms using smart farm guidance systems generally keep records. Due to the scale at which farms in the region operate, there is a sizable incentive to use smart farming due to the cost reduction potential it presents. As a result, the use of smart farming in many cases drives up the collection of various forms of farm attribute data from soil attributes to yield data.
Primary identifiers for farmers
The Canadian Government issues a Social Insurance Number. Although authoritative information regarding the penetration and scale of use of this unique identifier remains publicly unavailable, the identifier is required for one work in Canada or to have access to Government programmes and benefits.[50] Most of the farming operations in Canada are formally registered.[51] By 2016, an estimated 51.7 per cent of all Canadian farms were registered as sole proprietorships. An additional 22.9 per cent were partnerships, with the remaining fraction of farms being made up of family and non-family cooperation.[52] In addition, the Canadian National Farmers’ Union also has a number of formally registered farmers in the country. The proportion of farmers formally registered through this avenue is unclear.
Primary identifiers for farmers land parcels
In the digitalisation of agriculture, land identifiers are critical in the development of solutions that are customised to farm environments. By 2016, 39 per cent of all farmlands in Canada were leased.[53] While there is a void of publicly available information in Canada that documents the tenure agreements of agricultural farmland in Canada, inference regarding the farming tenure arrangements can be made by referring to the fact that most of the land in Canada is owned by regional and provisional Governments. This hence reveals that most farming arrangements in Canada are on lands whose tenure is formally documented. In Canada, an estimated 89 per cent of land is owned by both federal and provincial Governments, with only 11 per cent being privately held by individuals.[54]This statistic effectively means that most farmers in the region use land parcels with documented user rights.
4.5.3 Business development services for digitalisation of agriculture in Canada
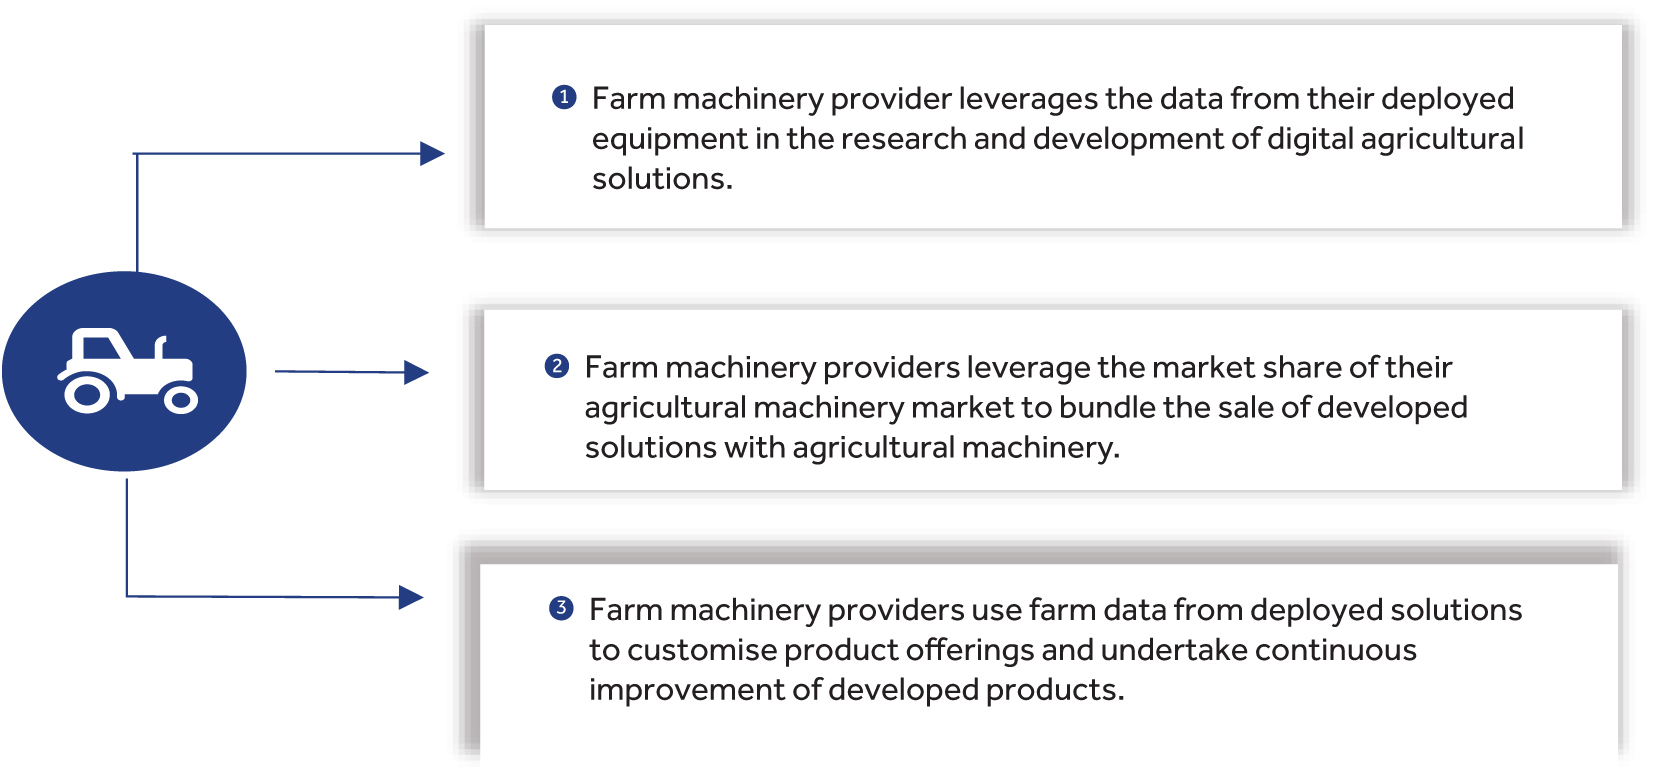
In Canada, one existent business model is the bundled sale of digital innovation with farm machinery like tractors and combine harvesters. In this model, machinery manufacturers with the lion's share of the tractor and combine harvesters’ market like John Deere, Kubota, Caterpillar and Rostselmash leverage their position in commercial farming operations in the region to sell smart farming technology alongside their agricultural machinery. Examples of such sales include the sale of variable rate application software, field mapping applications and global navigation satellite systems for tractors. These equipment providers like John Deere also provide cloud storage for farm hardware data and mobile applications with related advisory information.[55]
4.5.4 Enabling environment for digitalisation of agriculture in Canada
Technology enablers
1. Connectivity: Majority of Canadians (84.1 per cent) have internet access with download speeds of up to 50 megabits per second, and 10 megabits per second upload speeds. Canada has significantly lower access and coverage gaps than other countries in the Commonwealth. The Canadian Radio-television and Telecommunications Commission (CRTC1) also estimates that 94 per cent of the Canadian households now have access to wired broadband connections, with 69 per cent of the households subscribing to high-speed service. Canadian wireless broadband connections are currently dominated by 4G connections, and the country is making advancements in its transition towards 5G2. Almost half of all mobile connections in North America are forecast to be running on 5G networks by 2025. This suggests that the region will migrate to 5G at a much faster rate than comparable markets in Europe and Asia.
2. Mobile penetration: Canada has one of the highest mobile device penetration rates in the world, with an estimated 92 mobile subscriptions per 100 inhabitants.[56] Canada also has one of the highest smartphone penetration rates, with an estimated 81 per cent smartphone penetration rate by 2019. This smartphone penetration rate was further predicted to rise to an estimated 90 per cent by 2025.[57]
Non-technology enablers
1. The profitability objective: Agricultural technologies can be viewed as means through which farmers seek to achieve their production objectives. Farmers have many objectives, including risk management, quality of life and environmental stewardship. Most Canadian farmers have profitability as the primary objective for their agriculture. As such, the cost reduction potential for digital agricultural solutions, especially those in the smart farming domain, are very attractive1. Unlike domains with large numbers of smallholder farmers, the farmers in this region mainly use digital farming solutions for the main objective of dealing with business management and governance challenges/requirements.
2. High Digital literacy: Two-nine per cent of the Canadian farmers have a secondary school diploma or equivalent, 21 per cent a college or CEGEP diploma (the British equivalent of a community college diploma) and 15 per cent a university degree or diploma at the bachelor’s level or above. Additionally, farmers with an apprenticeship or trades certificate or diploma make up about 14 per cent of the Canadian farmers.[58] A 2013 Statistics Canada study on the OECD Programme for the International Assessment of Adult Competencies (PIAAC) measured the literacy, numeracy and problem-solving in technology-rich environments (PS-TRE) skills of Canadians. They found that Canadian adults on average had better problem-solving skills. When more farmers are digitally literate, they are more likely to consume digital agriculture solutions effectively as they can easily operate mobile phones, field sensors and computers.
4.5.5 Lessons from the digital agricultural environment in Canada
- Distribution of state-provided soil and weather data as APIs. Unlike other several Governments in Commonwealth countries, the Canadian Government distributes its soil and weather data using web Application Programme Interfaces (APIs).[59] This creates an opportunity for digital agriculture solution developers to build digital agricultural solutions that can leverage this open-source data
- Investing in robust national Agri-statistical data sets. The Canadian statutory statistical body (Statistics Canada) carries out annual national farmer surveys that are nationally representative and provides the resultant survey data as an open-source resource. Unlike in many other Commonwealth countries where national agricultural surveys do not occur regularly, the regular occurrence of surveys and dissemination of such data in Canada enables solution developers to build agricultural solutions in the region that are based on the actual farmer needs and requirements.
- Utilisation of high-quality open-source data in the development of digital agricultural solutions. Unlike many other Commonwealth Governments, the Canadian Government leverages high-quality data resources, for example, the Soil Moisture and Ocean Salinity (SMOS) data from the European Space Agency in state-provided digital agriculture solutions. This provides avenues for the creation of digital agriculture solutions in the region that utilise high-quality data resources at no cost.
- Investing in closing the rural broadband divide. The Canadian Radio-television and Telecommunications Commission (CRTC) works with internet service providers in the Country to enhance the connectivity to affordable wireless broadband (which is defined by the CRTC as having download speeds of 50 megabits per second, and upload speeds of 10 megabits per second).[60] The constant roll-outs of reliable internet connections facilitate constant data transmission and set the environment for the use of smart farming solutions.[61
- Implementation of policies that dictate that MNOs share network equipment. The Canadian authorities facilitate the formulation of policies in the region that require various carriers and mobile network operators to share equipment. This lowers the cost of network roll-out for new mobile broadband operators and creates more affordable internet connections and choices for Canadian internet consumers. This in effect supports the adoption of smart farming solutions by bringing down the overall cost of connectivity.[62]
- Formal registration of farming operations as business entities. In Canada, an estimated 26 per cent of the farming entities are formally registered as business entities. This means that they have their asset bases, and their transaction histories are formally documented. In addition, they regularly report to state entities. The fact that the farming operations are business entities also ensures that solution developers have a wider number of potential sources of digital agriculture solutions since the farming entities are attracted to digital solutions due to their cost reduction potential.
- The bundled sale of agricultural machinery and digital agricultural solutions. As with several other countries with highly mechanised agriculture, larger average farm sizes, monoculture and export-oriented farming operations, the Canadian agriculture equipment manufacturers in many cases offer a bundled sale of digital solutions with farm agricultural machinery.[63]
Digital Agriculture report homepage Next chapter Back to top ⬆
[1] Food and Agriculture Organisation of the United Nations, FAOSTAT. Data retrieved on August 8, 2021. Retrieved from http://www.fao.org/faostat/en/#data
[2] Food and Agriculture Organization of the United Nations (2021). Small Island Developing States. http://www.fao.org/sids/en/ (accessed on 10th July 2021).
[3] Canadian Agri-Food Trade Alliance (2017). Agri-Food Exports. https://cafta.org/agri-food-exports/ (accessed on 10th July 2021).
[4] Chen, C., I. Noble and J. Hellmann (2015). University of Notre Dame Global Adaptation Index. https://gain.nd.edu/our-work/country-index/matrix/
[5] Munich Climate Insurance Initiative (2021). Climate Risk Adaptation and Insurance in the Caribbean (CRAIC). https://climate-insurance.org/projects/climate-risk-adaptation-and-insu…
[6] Food and Agriculture Organisation of the United Nations, FAOSTAT. Data retrieved on August 8, 2021. Retrieved from http://www.fao.org/faostat/en/#data
[7] United Nations Statistics Division, UNSD Data retrieved on August 8, 2021. Retrieved from https://unstats.un.org/home/
[8] FAO (2014). FAO’s Work with Small Island Developing Countries. http://www.fao.org/3/ca5170en/ca5170en.pdf
[9] United Nations Conference on Trade and Development, UNCTAD maritime connectivity. Data retrieved on August 8, 2021. Retrieved from https://unctadstat.unctad.org/wds/TableViewer/tableView.aspx?ReportId=92
[10] UNCTAD (2017). Available from: http://unctadstat.unctad.org/wds/TableViewer/tableView.aspx?ReportId=92
[11] OECD (2021). COVID-19 pandemic: Towards a blue recovery in small island developing states. https://www.oecd.org/coronavirus/policy-responses/covid-19-pandemic-tow…
[12] Novascotica (2020). Coronavirus (COVID-19): Agriculture Response Program. https://novascotia.ca/coronavirus/agriculture-response-program/
[13] Ministry of Agriculture Guyana (2021). Minister Mustapha Talks Up Lessons Learned And ‘Post Covid-19 Priorities’ For Agriculture In Guyana. http://agriculture.gov.gy/2021/03/27/minister-mustapha-talks-up-lessons…
[14] KPMG (2020). Trinidad and Tobago, Government and institution measures in response to COVID-19.
[15] USDA Foreign Agricultural service (2020). Jamaica: Impact of COVID-19 on the Jamaican Agriculture Sector. https://www.fas.usda.gov/data/jamaica-impact-covid-19-jamaican-agricult…
[16] CARICOM (2020). Caribbean COVID-19 Food Security & Livelihoods Impact Survey. https://docs.wfp.org/api/documents/WFP-0000114475/download/?_ga=2.37829…
[17] Food and Agriculture Organisation of the United Nations, FAOSTAT. Data retrieved on August 8th, 2021. Retrieved from http://www.fao.org/faostat/en/#data
[18] Atwell, M. and M.N. Wuddivira (2012). Proximal Soil Sensing Using Electromagnetic-induction For Precision Agriculture In The Caribbean.
[19] International Fund for Agricultural Development (2018). IFAD’s support for land and natural resource tenure security. https://www.ifad.org/en/web/knowledge/-/publication/ifad-s-support-for-…
[20] https://farmcredibly.com/ (accessed on July 10, 2021).
[21] https://farmcredibly.com/project/kevin-buchanan (accessed on July 10, 2021).
[22] Dijkshoorn, K. et al. (2005). Update of the 1:5 million Soil and Terrain Database for Latin America and the Caribbean (SOTERLAC). https://www.isric.org/sites/default/files/isric_report_2005_01.pdf
[23] Graham, B. (2012). Profile of the Small-Scale Farming in the Caribbean. http://www.fao.org/3/au343e/au343e.pdf
[24] Lowder, S.K., J. Skoet and T. Raney (2016). ‘The number, size, and distribution of farms, smallholder farms, and family farms worldwide’. World Development 87, 16–29. http://www.fao.org/family-farming/detail/en/c/386784/
[25] Williams, A.N. (2003). Land in the Caribbean issues of policy, administration and management in the English-speaking Caribbean. http://www.terrainstitute.org/carib_workshop/pdf/landbook.pdf
[26] McNaughton, M. and D. Soutar (2015) Agricultural Open Data in the Caribbean. https://www.cta.int/en/digitalisation/issue/agricultural-open-data-in-t…
[27] The World Bank, World Bank indicator database. Data retrieved on August 8th, 2021. Retrieved from https://data.worldbank.org/indicator/IT.NET.USER.ZS
[28] Fonseca-Hoeve, I. et al. (2017). Unleashing the Internet in the Caribbean Removing Barriers to Connectivity and Stimulating Better Access in the Region. https://unctad.org/system/files/non-official-document/dtl_eWeek2017c06-…
[29] Addison, C., K. Lohento, D. Okello and G. Rambaldi (2013). The ICT update, small islands and e-resilience. https://cgspace.cgiar.org/handle/10568/75312
[30] The World Bank, World Bank indicator database. Data retrieved on August 8, 2021. Retrieved from https://data.worldbank.org/indicator/IT.CEL.SETS.P2
[31] Addison, C., K. Lohento, D. Okello and G. Rambaldi (2013) The ICT update, small islands and e-resilience. http://ict4ag.cta.int/2017/06/06/72-ict-update-71-english-small-islands…
[32] Global System for Mobile Communications (2016) Digital inclusion in Latin America and the Caribbean. https://www.gsma.com/mobilefordevelopment/wp-content/uploads/2015/02/Co…
[33] The GSMA Mobile Connectivity Index3 measures the enablers of mobile internet connectivity. This index provides an aggregated quantifiable measure for selected indicators enablers of mobile connectivity. These indicators are Infrastructure – the availability of high-performance mobile internet network coverage; Affordability – the availability of mobile services and devices at price points that reflect the level of income across a national population; Consumer readiness – citizens with the awareness and skills needed to value and use the internet, and a cultural environment that promotes gender equality; Content – the availability of online content and services accessible and relevant to the local population.
[34] Griffith, R., S. Redding and J. Van Reenen (2001). Measuring the Cost-Effectiveness of an R&D Tax Credit for the UK. https://ifs.org.uk/fs/articles/0047a.pdf
[35] A2i initiative Bangladesh Access to Information (a2i-II) Programme Final Project Review Report, 2019. https://info.undp.org/docs/pdc/Documents/BGD/UNDP%20a2i-II%20closing%20…
[36] Capacity Needs Assessment for Improving Agricultural Statistics in Kenya, The World Bank group, 2020. https://documents1.worldbank.org/curated/en/801111542740476532/pdf/Capa…
[37] McKinsey & Company (2019). Digital India: Technology to transform a connected nation.
[38] Government of Canada (2019). Percent Saturated Surface Soil Moisture from SMOS Satellite Data.
[39] Research and development in New Zealand, 2019, New Zealand government. https://www.stats.govt.nz/assets/Uploads/Reports/Research-and-developme…
[40] Alliance For Affordable Internet (2015). How Can Public-Private Partnerships Increase Affordable Internet Access? https://a4ai.org/how-can-public-private-partnerships-increase-affordabl…
[41] Paul Brooks (2009). Project Briefing Architecture Reference Model.
[42] Global System for Mobile Communications (2019). Case Study: RuralStar Huawei Safaricom. https://www.gsma.com/futurenetworks/wiki/ruralstar-huawei-safaricom-cas…
[43] Rwanda signs 4G internet deal with South Korea's KT Corp, 2019, Jenny Clover. https://www.reuters.com/article/net-us-rwanda-internet-idUSBRE9590SH201…
[44] Say, S.M. and M. Keskin (2017). Adoption Of Precision Agriculture Technologies In Developed And Developing Countries. https://www.researchgate.net/publication/320908156_Adoption_of_Precisio…
[45] https://semios.com/ (accessed on July 14, 2020).
[46] Phillips, P.W.B. (2019). Configuring the new digital landscape in western Canadian agriculture. https://www.sciencedirect.com/science/article/pii/S1573521418302264
[47] Government of Canada (2020). The National Soil Database. https://sis.agr.gc.ca/cansis/nsdb/index.html
[48] Government of Canada (2020). Satellite SMOS (Soil Moisture Ocean Salinity). https://www.asc-csa.gc.ca/eng/satellites/smos/default.asp
[49] Phillips, P.W.B. (2019). Configuring the new digital landscape in western Canadian agriculture. https://www.sciencedirect.com/science/article/pii/S1573521418302264
[50] Government of Canada (2021). Social Insurance Number. https://www.canada.ca/en/employment-social-development/services/sin.html (accessed on July 14, 2021).
[51] Statistics Canada (2016). Census of Agriculture. https://www150.statcan.gc.ca/n1/daily-quotidien/170510/dq170510a-eng.htm (accessed on July 14, 2021).
[52] Federal Communications Commission (2020). FCC farmland rental rates analysis. https://www.fcc-fac.ca/en/knowledge/economics/farmland-rental-rates-ana… (accessed on July 14, 2021).
[53] National Farmers Union (2021). https://www.nfu.ca/
[54] Neimanis, V.P. (2011). Crown Land. https://www.thecanadianencyclopedia.ca/en/article/crown-land (accessed on July 14, 2021).
[55] Phillips, P.W.B. (2019). Configuring the new digital landscape in western Canadian agriculture.
[56] Phillips, P. W.B. (2019). Configuring the new digital landscape in western Canadian agriculture. https://www.sciencedirect.com/science/article/pii/S1573521418302264
[57] Global System for Mobile Communications (2020). The Mobile Economy North America. https://data.gsmaintelligence.com/research/research/research-2020/the-m… 2020#:~:text=In%202019%2C%20mobile%20technologies%20and,almost%20%24100%20billion%20through%20taxation
[58] Canadian Radio-television and Telecommunications Commission (2019). Communications Monitoring Report 2019. https://crtc.gc.ca/pubs/cmr2019-en.pdf
[59] Application programming interface (API) is an interface that provides programmatic access to service functionality and data within an application or a database.
[60] Haak, D.E. (2011). Precision Agriculture Development in Canada. International Conference on Precision Agriculture. 6pp. https://www.ispag.org/proceedings/?action=download&item=502
[61] Middleton, C. et al. (2010). Intensity of Internet Use in Canada: Understanding Different Types of Users. https://www.researchgate.net/publication/239588641_Intensity_of_Interne…
[62] Canadian Radio-television and Telecommunications Commission. https://crtc.gc.ca/eng/home-accueil.htm#:~:text=Phone-,Canadian%20Radio…
[63] Phillips, P.W.B. (2019). Configuring the new digital landscape in western Canadian agriculture. https://www.sciencedirect.com/science/article/pii/S1573521418302264
Digital Agriculture report homepage Next chapter Back to top ⬆